Question
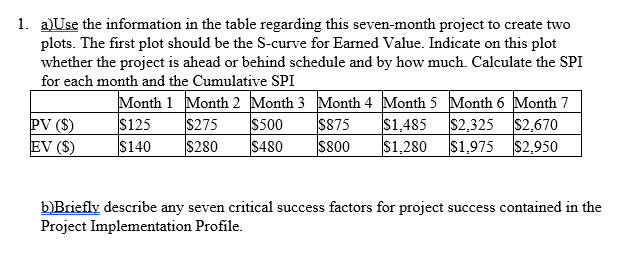
1. a)Use the information in the table regarding this seven-month project to create two plots. The first plot should be the S-curve for Earned

1. a)Use the information in the table regarding this seven-month project to create two plots. The first plot should be the S-curve for Earned Value. Indicate on this plot whether the project is ahead or behind schedule and by how much. Calculate the SPI for each month and the Cumulative SPI Month 1 Month 2 Month 3 Month 4 Month 5 Month 6 Month 7 $2,325 $2,670 $125 $500 $875 $275 $140 $280 $480 $800 $1,485 $1,280 $1,975 $2,950 PV ($) EV ($) b)Briefly describe any seven critical success factors for project success contained in the Project Implementation Profile.
Step by Step Solution
3.31 Rating (157 Votes )
There are 3 Steps involved in it
Step: 1
a To create the Scurve for Earned Value we will plot the Planned Value PV and Earned Value EV for each month The Scurve will show the cumulative progr...
Get Instant Access to Expert-Tailored Solutions
See step-by-step solutions with expert insights and AI powered tools for academic success
Step: 2

Step: 3

Ace Your Homework with AI
Get the answers you need in no time with our AI-driven, step-by-step assistance
Get StartedRecommended Textbook for
Cost management a strategic approach
Authors: Edward J. Blocher, David E. Stout, Gary Cokins
5th edition
73526940, 978-0073526942
Students also viewed these General Management questions
Question
Answered: 1 week ago
Question
Answered: 1 week ago
Question
Answered: 1 week ago
Question
Answered: 1 week ago
Question
Answered: 1 week ago
Question
Answered: 1 week ago
Question
Answered: 1 week ago
Question
Answered: 1 week ago
Question
Answered: 1 week ago
Question
Answered: 1 week ago
Question
Answered: 1 week ago
Question
Answered: 1 week ago
Question
Answered: 1 week ago
Question
Answered: 1 week ago
Question
Answered: 1 week ago
Question
Answered: 1 week ago
Question
Answered: 1 week ago
Question
Answered: 1 week ago
Question
Answered: 1 week ago
Question
Answered: 1 week ago
Question
Answered: 1 week ago
Question
Answered: 1 week ago
View Answer in SolutionInn App


