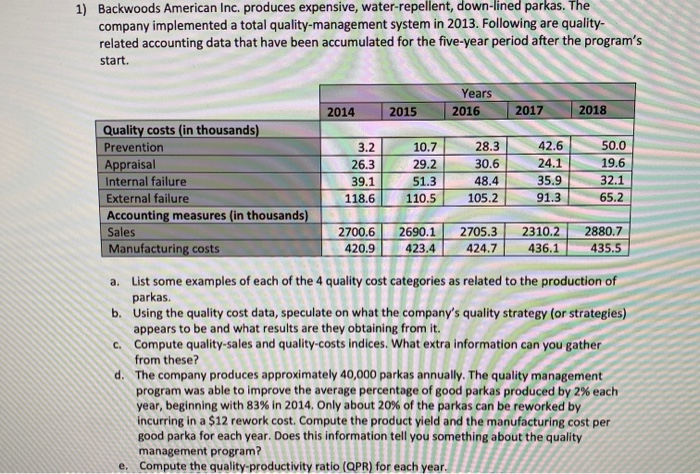
1) Backwoods American Inc. produces expensive, water-repellent, down-lined parkas. The company implemented a total quality-management system in 2013. Following are quality- related accounting data that have been accumulated for the five-year period after the program's start. Years 2016 2014 2015 2017 2018 Quality costs (in thousands) Prevention Appraisal Internal failure External failure Accounting measures (in thousands) Sales Manufacturing costs 3.2 26.3 39.1 118.6 10.7 29.2 51.3 110.5 28.3 30.6 48.4 105.2 42.6 24.1 35.9 91.3 50.0 19.6 32.1 65.2 2700.6 420.9 2690.1 423.4 27 424.7 2310.2 436.1 2880.7 435.5 a. List some examples of each of the 4 quality cost categories as related to the production of parkas. b. Using the quality cost data, speculate on what the company's quality strategy (or strategies) appears to be and what results are they obtaining from it. C. Compute quality-sales and quality-costs indices. What extra information can you gather from these? d. The company produces approximately 40,000 parkas annually. The quality management program was able to improve the average percentage of good parkas produced by 2% each year, beginning with 83% in 2014. Only about 20% of the parkas can be reworked by incurring in a $12 rework cost. Compute the product yield and the manufacturing cost per good parka for each year. Does this information tell you something about the quality management program? e. Compute the quality productivity ratio (QPR) for each year. 1) Backwoods American Inc. produces expensive, water-repellent, down-lined parkas. The company implemented a total quality-management system in 2013. Following are quality- related accounting data that have been accumulated for the five-year period after the program's start. Years 2016 2014 2015 2017 2018 Quality costs (in thousands) Prevention Appraisal Internal failure External failure Accounting measures (in thousands) Sales Manufacturing costs 3.2 26.3 39.1 118.6 10.7 29.2 51.3 110.5 28.3 30.6 48.4 105.2 42.6 24.1 35.9 91.3 50.0 19.6 32.1 65.2 2700.6 420.9 2690.1 423.4 27 424.7 2310.2 436.1 2880.7 435.5 a. List some examples of each of the 4 quality cost categories as related to the production of parkas. b. Using the quality cost data, speculate on what the company's quality strategy (or strategies) appears to be and what results are they obtaining from it. C. Compute quality-sales and quality-costs indices. What extra information can you gather from these? d. The company produces approximately 40,000 parkas annually. The quality management program was able to improve the average percentage of good parkas produced by 2% each year, beginning with 83% in 2014. Only about 20% of the parkas can be reworked by incurring in a $12 rework cost. Compute the product yield and the manufacturing cost per good parka for each year. Does this information tell you something about the quality management program? e. Compute the quality productivity ratio (QPR) for each year