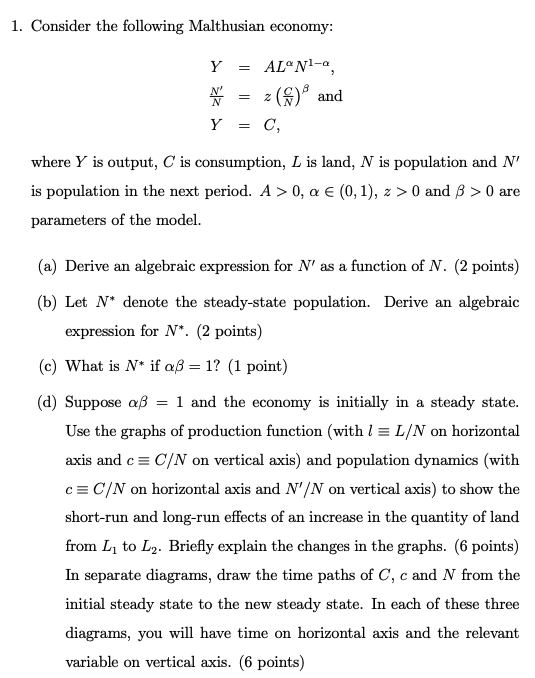
1. Consider the following Malthusian economy: Y N AL N1-o z () and C, Y = where Y is output, C is consumption, L is land, N is population and N' is population in the next period. A >0, a (0,1), 2 > 0 and 3 > 0 are parameters of the model. (a) Derive an algebraic expression for N' as a function of N. (2 points) (b) Let N* denote the steady-state population. Derive an algebraic expression for N*. (2 points) (c) What is N* if a = 1? (1 point) (d) Suppose a = 1 and the economy is initially in a steady state. Use the graphs of production function (with 1 = L/N on horizontal axis and c= C/N on vertical axis) and population dynamics (with C=C/N on horizontal axis and N'/N on vertical axis) to show the short-run and long-run effects of an increase in the quantity of land from L, to Ly. Briefly explain the changes in the graphs. (6 points) In separate diagrams, draw the time paths of C, c and N from the initial steady state to the new steady state. In each of these three diagrams, you will have time on horizontal axis and the relevant variable on vertical axis. (6 points) 1. Consider the following Malthusian economy: Y N AL N1-o z () and C, Y = where Y is output, C is consumption, L is land, N is population and N' is population in the next period. A >0, a (0,1), 2 > 0 and 3 > 0 are parameters of the model. (a) Derive an algebraic expression for N' as a function of N. (2 points) (b) Let N* denote the steady-state population. Derive an algebraic expression for N*. (2 points) (c) What is N* if a = 1? (1 point) (d) Suppose a = 1 and the economy is initially in a steady state. Use the graphs of production function (with 1 = L/N on horizontal axis and c= C/N on vertical axis) and population dynamics (with C=C/N on horizontal axis and N'/N on vertical axis) to show the short-run and long-run effects of an increase in the quantity of land from L, to Ly. Briefly explain the changes in the graphs. (6 points) In separate diagrams, draw the time paths of C, c and N from the initial steady state to the new steady state. In each of these three diagrams, you will have time on horizontal axis and the relevant variable on vertical axis. (6 points)


