Answered step by step
Verified Expert Solution
Question
1 Approved Answer
1. F ind each projects payback period, NPV, IRR, profitability index and equivalent annuity. There is no spreadsheet, you must fill in table below. Each
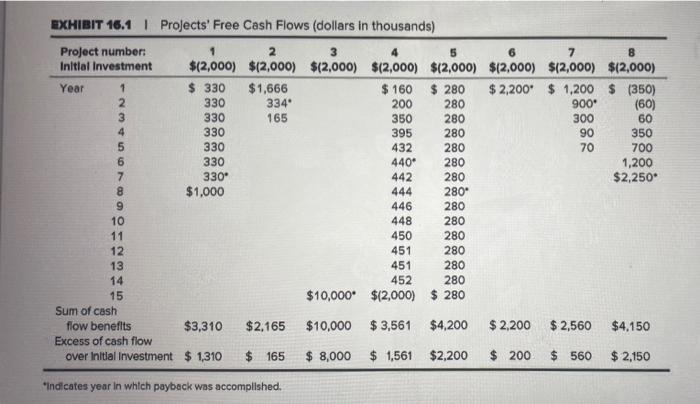
1. Find each projects payback period, NPV, IRR, profitability index and equivalent annuity. There is no spreadsheet, you must fill in table below. Each project data is found in the chart below. 

Analysis Tule of Plans NetValue 104 Internal Rate of PY The way that conta w dorities the title of the by gb E Amuanya EXHIBIT 16.1 Projects' Free Cash Flows (dollars in thousands) (60) Project number: 1 2 3 5 6 7 8 Initial Investment $(2,000) $(2,000) $(2,000) $(2,000) $(2,000) $12,000) $12,000) $(2,000) Year 1 $ 330 $1,666 $ 160 $ 280 $2,200* $ 1,200 $ (350) 2 330 334 200 280 900' 330 165 350 280 300 60 4 330 395 280 90 350 5 330 432 280 70 700 6 330 440* 280 1,200 7 330 442 280 $2,250" 8 $1,000 444 280 9 446 280 10 448 280 11 450 280 12 451 280 13 451 280 14 452 280 15 $10,000* $12,000) $ 280 Sum of cash flow benefits $3,310 $2,165 $10,000 $3,561 $4,200 $ 2,200 $ 2,560 $4,150 Excess of cash flow over Initial Investment $ 1,310 $ 165 $ 8,000 $ 1,561 $2,200 $ 200 $ 560 $ 2,150 indicates year in which payback was accomplished. Analysis Tule of Plans NetValue 104 Internal Rate of PY The way that conta w dorities the title of the by gb E Amuanya EXHIBIT 16.1 Projects' Free Cash Flows (dollars in thousands) (60) Project number: 1 2 3 5 6 7 8 Initial Investment $(2,000) $(2,000) $(2,000) $(2,000) $(2,000) $12,000) $12,000) $(2,000) Year 1 $ 330 $1,666 $ 160 $ 280 $2,200* $ 1,200 $ (350) 2 330 334 200 280 900' 330 165 350 280 300 60 4 330 395 280 90 350 5 330 432 280 70 700 6 330 440* 280 1,200 7 330 442 280 $2,250" 8 $1,000 444 280 9 446 280 10 448 280 11 450 280 12 451 280 13 451 280 14 452 280 15 $10,000* $12,000) $ 280 Sum of cash flow benefits $3,310 $2,165 $10,000 $3,561 $4,200 $ 2,200 $ 2,560 $4,150 Excess of cash flow over Initial Investment $ 1,310 $ 165 $ 8,000 $ 1,561 $2,200 $ 200 $ 560 $ 2,150 indicates year in which payback was accomplished You have to report both calculated numbers and formulas so you will report two versions of the same table.
Please show work and provide explanation if you can I need dire help :(


Step by Step Solution
There are 3 Steps involved in it
Step: 1

Get Instant Access to Expert-Tailored Solutions
See step-by-step solutions with expert insights and AI powered tools for academic success
Step: 2

Step: 3

Ace Your Homework with AI
Get the answers you need in no time with our AI-driven, step-by-step assistance
Get Started


