

Answered step by step
Verified Expert Solution
Question
1 Approved Answer
. 1. For the following concentration expressions, indicate whether they are uniform or nonuniform and in how many dimensions (OD, 1D, 2D, or 3D), and
.
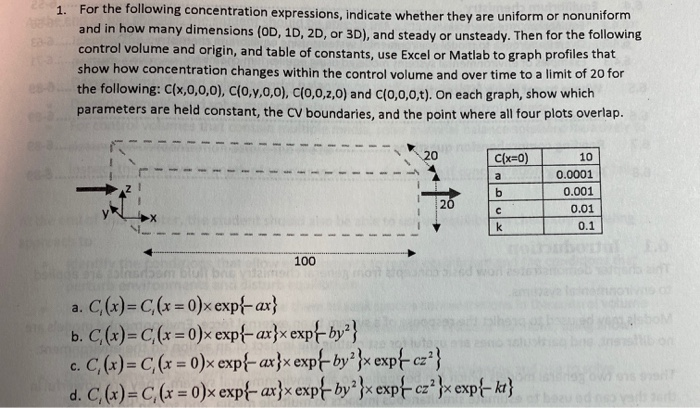
1. For the following concentration expressions, indicate whether they are uniform or nonuniform and in how many dimensions (OD, 1D, 2D, or 3D), and steady or unsteady. Then for the following control volume and origin, and table of constants, use Excel or Matlab to graph profiles that show how concentration changes within the control volume and over time to a limit of 20 for the following: C(x,0,0,0), Clo,7,0,0), C(0,0,2,0) and c(0,0,0,t). On each graph, show which parameters are held constant, the CV boundaries, and the point where all four plots overlap. C(x=0) 10 0.0001 0.001 0.01 0.1 100 bo a. C(x)=C(x =0)xexp{-ax} b. C(x)=C(x=0)x exp{-ax}x expt by?} hod c. C(x)=C(x = 0)x exp{- ax}x exp by2}x exp cza} d. C(x)=C (x = 0)x exp{- ax}x exp by2}x exp'cz?}x exp{- kt} Step by Step Solution
There are 3 Steps involved in it
Step: 1

Get Instant Access to Expert-Tailored Solutions
See step-by-step solutions with expert insights and AI powered tools for academic success
Step: 2

Step: 3
Ace Your Homework with AI
Get the answers you need in no time with our AI-driven, step-by-step assistance
Get Started
Moving Objects Databases
Authors: Ralf Hartmut Güting, Markus Schneider
1st Edition
0120887991, 978-0120887996