

Answered step by step
Verified Expert Solution
Question
1 Approved Answer
please show how to solve e and f using r studio L. Petersen et al. evaluated the effects of integrated treatment for patients with a
please show how to solve e and f using r studio
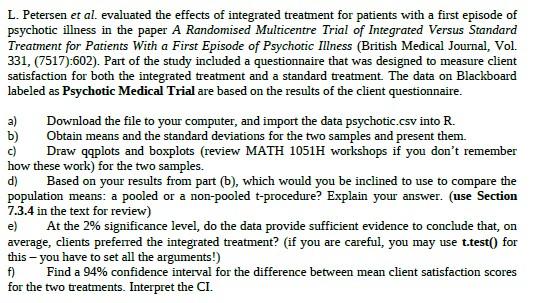
L. Petersen et al. evaluated the effects of integrated treatment for patients with a first episode of psychotic illness in the paper A Randomised Multicentre Trial of Integrated Versus Standard Treatment for Patients with a First Episode of Psychotic Illness (British Medical Journal, Vol. 331, (7517):602). Part of the study included a questionnaire that was designed to measure client satisfaction for both the integrated treatment and a standard treatment. The data on Blackboard labeled as Psychotic Medical Trial are based on the results of the client questionnaire. a) Download the file to your computer, and import the data psychotic.csv into R. b) Obtain means and the standard deviations for the two samples and present them. c) Draw qqplots and boxplots (review MATH 1051H workshops if you don't remember how these work) for the two samples. d) Based on your results from part (b), which would you be inclined to use to compare the population means: a pooled or a non-pooled t-procedure? Explain your answer. (use Section 7.3.4 in the text for review) e) At the 2% significance level, do the data provide sufficient evidence to conclude that, on average, clients preferred the integrated treatment? (if you are careful, you may use t.test() for this - you have to set all the arguments!) f) Find a 94% confidence interval for the difference between mean client satisfaction scores for the two treatments. Interpret the CI. L. Petersen et al. evaluated the effects of integrated treatment for patients with a first episode of psychotic illness in the paper A Randomised Multicentre Trial of Integrated Versus Standard Treatment for Patients with a First Episode of Psychotic Illness (British Medical Journal, Vol. 331, (7517):602). Part of the study included a questionnaire that was designed to measure client satisfaction for both the integrated treatment and a standard treatment. The data on Blackboard labeled as Psychotic Medical Trial are based on the results of the client questionnaire. a) Download the file to your computer, and import the data psychotic.csv into R. b) Obtain means and the standard deviations for the two samples and present them. c) Draw qqplots and boxplots (review MATH 1051H workshops if you don't remember how these work) for the two samples. d) Based on your results from part (b), which would you be inclined to use to compare the population means: a pooled or a non-pooled t-procedure? Explain your answer. (use Section 7.3.4 in the text for review) e) At the 2% significance level, do the data provide sufficient evidence to conclude that, on average, clients preferred the integrated treatment? (if you are careful, you may use t.test() for this - you have to set all the arguments!) f) Find a 94% confidence interval for the difference between mean client satisfaction scores for the two treatments. Interpret the CIStep by Step Solution
There are 3 Steps involved in it
Step: 1

Get Instant Access to Expert-Tailored Solutions
See step-by-step solutions with expert insights and AI powered tools for academic success
Step: 2

Step: 3
Ace Your Homework with AI
Get the answers you need in no time with our AI-driven, step-by-step assistance
Get Started
Moving Objects Databases
Authors: Ralf Hartmut Güting, Markus Schneider
1st Edition
0120887991, 978-0120887996