

Question
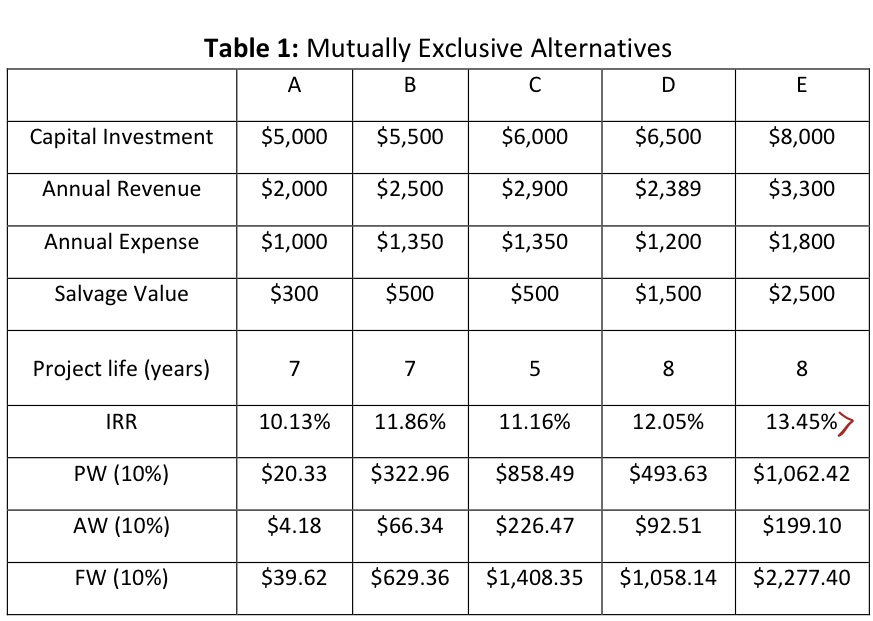
1) From the table 1 below , If the MARR= 12 %, select the correct choice a) We cannot compare projects based on the PW.
1) From the table 1 below , If the MARR= 12 %, select the correct choice a) We cannot compare projects based on the PW. b) Since FW of project E is the highest, it is the best alternative. c) Since the life of projects are different, we can only compare projects based on the AW. d) We cannot compare projects based on IRR when they have different life. e) If company decreases MARR to 8 %, number of available alternatives decreases.Justify:_______________________________________________________________________2) When 2 projects are evaluated using AW and both values are negative, select the best answer: a) Neither project should be rejected b) Select the project with the least negative value c) Select the project with the most negative value d) We need to consider IRR e) Rank them in order from cheapest to expensive using the initial costsJustify:_______________________________________________________________________3) To find the most profitable project among a set of potential candidates: a) Evaluate them using AW if they have different lives, or PW or FW if they have equal lives. Then select the one with the most negative value. b) Evaluate them using AW if they have different lives, or PW or FW if they have equal lives. Then select the one with the most positive value. c) Evaluate them using PW or FW if they have different lives, or AW if they have equal lives. Then select the one with the most negative value. d) Compare MARR and choose the project with the highest MARR e) Compare IRR and choose the project with the highest IRRJustify:_______________________________________________________________________4) To find the number of years that a project will take to recover its initial investment, considering all yearly expenses, revenues, etc. The best tool to implement is: a) IRR analysis b) Sensitivity Analysis c) PW or FW analysis d) AW analysis e) Breakeven AnalysisJustify:
Step by Step Solution
There are 3 Steps involved in it
Step: 1

Get Instant Access to Expert-Tailored Solutions
See step-by-step solutions with expert insights and AI powered tools for academic success
Step: 2

Step: 3
Ace Your Homework with AI
Get the answers you need in no time with our AI-driven, step-by-step assistance
Get Started
Lectures On Urban Economics
Authors: Jan K Brueckner
1st Edition
0262300311, 9780262300315