

Question
1. In the graph below, X and Y represent A. U.S. stocks (X) and international stocks (Y) B. U.S. stocks (Y) and international stocks (X)
1. In the graph below, X and Y represent 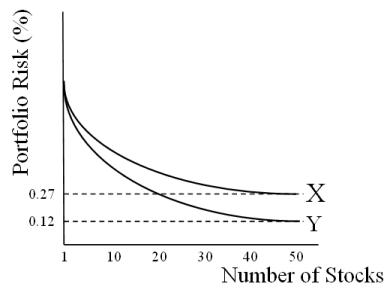
A. U.S. stocks (X) and international stocks (Y) B. U.S. stocks (Y) and international stocks (X) C. systematic risk (X) and unsystematic risk (Y) D. systematic risk (Y) and unsystematic risk (X)
E. none of the above
Portfolio Risk (0) 0.27 X 0.12 -Y 1 10 20 30 40 50 Number of StocksStep by Step Solution
There are 3 Steps involved in it
Step: 1

Get Instant Access to Expert-Tailored Solutions
See step-by-step solutions with expert insights and AI powered tools for academic success
Step: 2

Step: 3
Ace Your Homework with AI
Get the answers you need in no time with our AI-driven, step-by-step assistance
Get Started
Professionals Handbook Of Financial Risk Management
Authors: Lev Borodovsky, Marc Lore
1st Edition
0750641118, 978-0750641111