

Answered step by step
Verified Expert Solution
Question
1 Approved Answer
1. Inhibited Michaelis-Menten kinetics ( 30 points): Determine the KM and VM values for an enzyme system based upon the enzyme rate (R) versus substrate
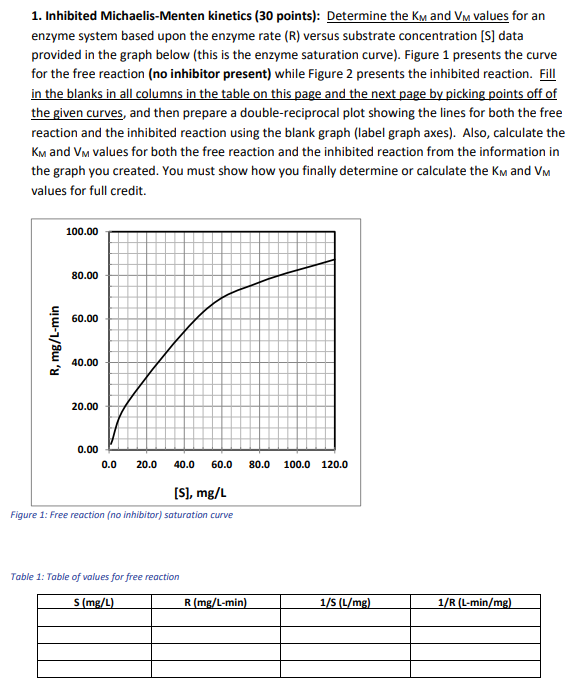
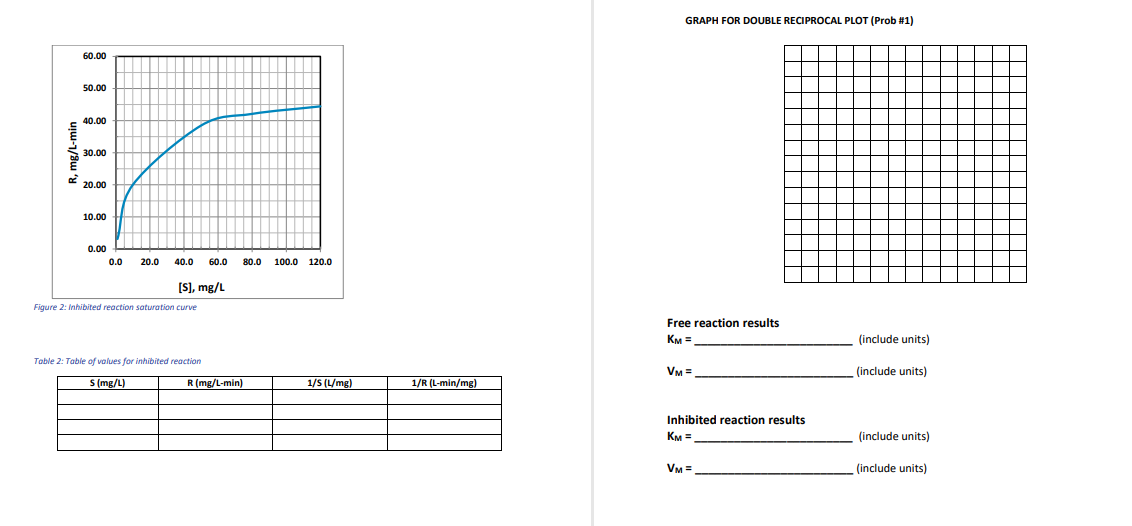 1. Inhibited Michaelis-Menten kinetics ( 30 points): Determine the KM and VM values for an enzyme system based upon the enzyme rate (R) versus substrate concentration [S] data provided in the graph below (this is the enzyme saturation curve). Figure 1 presents the curve for the free reaction (no inhibitor present) while Figure 2 presents the inhibited reaction. Fill in the blanks in all columns in the table on this page and the next page by picking points off of the given curves, and then prepare a double-reciprocal plot showing the lines for both the free reaction and the inhibited reaction using the blank graph (label graph axes). Also, calculate the KM and VM values for both the free reaction and the inhibited reaction from the information in the graph you created. You must show how you finally determine or calculate the KM and VM values for full credit. Figure 1: Free reaction (no inhibitor) saturation curve Table 1: Table of values for free reaction GRAPH FOR DOUBLE RECIPROCAL PLOT (Prob \#1) Figure 2: inhibited reaction saturation curve Free reaction results KM= (include units) Table 2: Table of volues for inhibited reaction VM= (include units) Inhibited reaction results KM= (include units) VM= (include units) 1. Inhibited Michaelis-Menten kinetics ( 30 points): Determine the KM and VM values for an enzyme system based upon the enzyme rate (R) versus substrate concentration [S] data provided in the graph below (this is the enzyme saturation curve). Figure 1 presents the curve for the free reaction (no inhibitor present) while Figure 2 presents the inhibited reaction. Fill in the blanks in all columns in the table on this page and the next page by picking points off of the given curves, and then prepare a double-reciprocal plot showing the lines for both the free reaction and the inhibited reaction using the blank graph (label graph axes). Also, calculate the KM and VM values for both the free reaction and the inhibited reaction from the information in the graph you created. You must show how you finally determine or calculate the KM and VM values for full credit. Figure 1: Free reaction (no inhibitor) saturation curve Table 1: Table of values for free reaction GRAPH FOR DOUBLE RECIPROCAL PLOT (Prob \#1) Figure 2: inhibited reaction saturation curve Free reaction results KM= (include units) Table 2: Table of volues for inhibited reaction VM= (include units) Inhibited reaction results KM= (include units) VM= (include units)
 Step by Step Solution
There are 3 Steps involved in it
Step: 1

Get Instant Access to Expert-Tailored Solutions
See step-by-step solutions with expert insights and AI powered tools for academic success
Step: 2

Step: 3
Ace Your Homework with AI
Get the answers you need in no time with our AI-driven, step-by-step assistance
Get Started
Elements Of Chemical Reaction Engineering
Authors: H. Fogler
6th Edition
013548622X, 978-0135486221