Answered step by step
Verified Expert Solution
Question
1 Approved Answer
1. Prepare a report that must have Matlab code, command window output, and plotting figures for each question. 2. Don't use any built-in functions


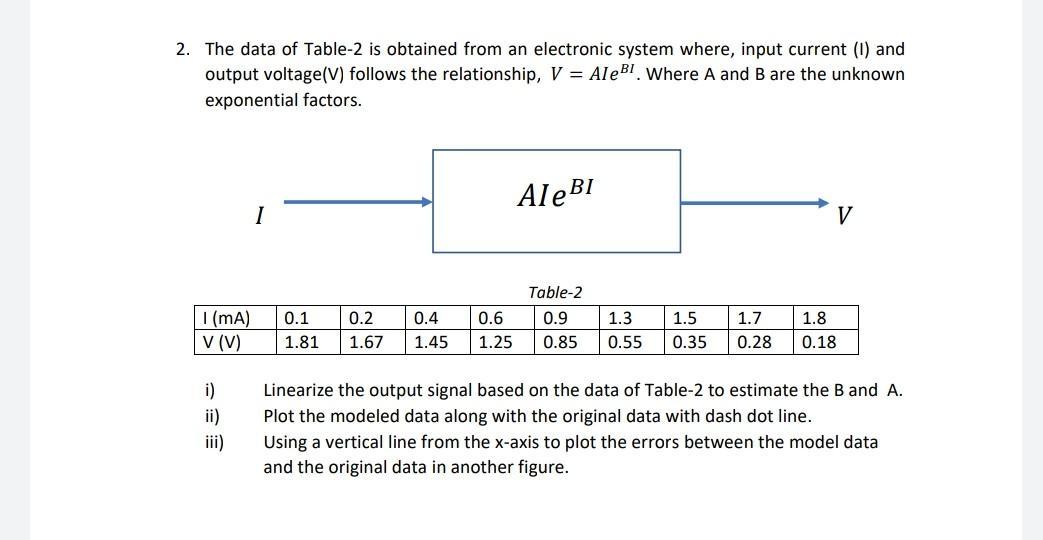
1. Prepare a report that must have Matlab code, command window output, and plotting figures for each question. 2. Don't use any built-in functions of curve fitting unless it is asked. 3. Start each code with %your full student ID (example %190105321) 2. The data of Table-2 is obtained from an electronic system where, input current (I) and output voltage (V) follows the relationship, V = Ale BI. Where A and B are the unknown exponential factors. I Ale BI V Table-2 I (mA) V (V) 0.1 0.2 0.4 0.6 0.9 1.3 1.5 1.7 1.8 1.81 1.67 1.45 1.25 0.85 0.55 0.35 0.28 0.18 i) ii) Linearize the output signal based on the data of Table-2 to estimate the B and A. Plot the modeled data along with the original data with dash dot line. iii) Using a vertical line from the x-axis to plot the errors between the model data and the original data in another figure.
Step by Step Solution
There are 3 Steps involved in it
Step: 1

Get Instant Access to Expert-Tailored Solutions
See step-by-step solutions with expert insights and AI powered tools for academic success
Step: 2

Step: 3

Ace Your Homework with AI
Get the answers you need in no time with our AI-driven, step-by-step assistance
Get Started


