Question
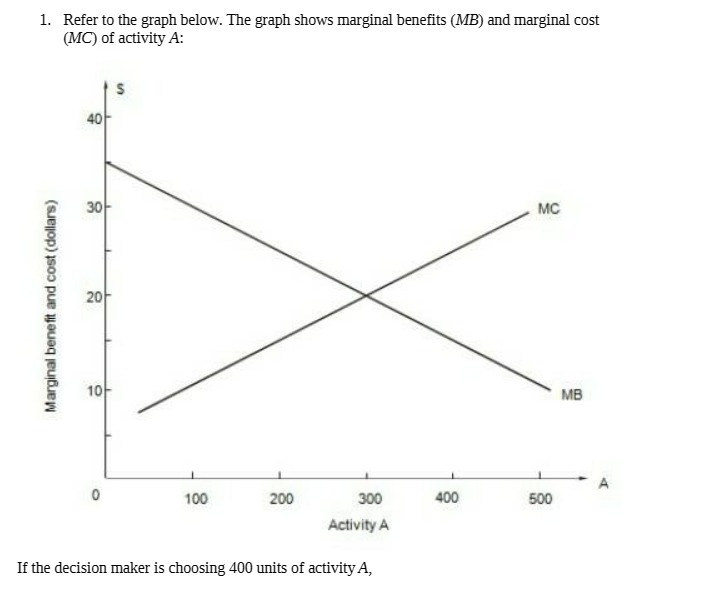
1. Refer to the graph below. The graph shows marginal benefits (MB) and marginal cost (MC) of activity A: Marginal benefit and cost (dollars)

1. Refer to the graph below. The graph shows marginal benefits (MB) and marginal cost (MC) of activity A: Marginal benefit and cost (dollars) 40 40 30- 201 10- MC MB A 100 200 300 400 500 Activity A If the decision maker is choosing 400 units of activity A,
Step by Step Solution
There are 3 Steps involved in it
Step: 1

Get Instant Access to Expert-Tailored Solutions
See step-by-step solutions with expert insights and AI powered tools for academic success
Step: 2

Step: 3

Ace Your Homework with AI
Get the answers you need in no time with our AI-driven, step-by-step assistance
Get StartedRecommended Textbook for
Microeconomics
Authors: Christopher T.S. Ragan, Richard G Lipsey
14th canadian Edition
321866347, 978-0321866349
Students also viewed these Economics questions
Question
Answered: 1 week ago
Question
Answered: 1 week ago
Question
Answered: 1 week ago
Question
Answered: 1 week ago
Question
Answered: 1 week ago
Question
Answered: 1 week ago
Question
Answered: 1 week ago
Question
Answered: 1 week ago
Question
Answered: 1 week ago
Question
Answered: 1 week ago
Question
Answered: 1 week ago
Question
Answered: 1 week ago
Question
Answered: 1 week ago
Question
Answered: 1 week ago
Question
Answered: 1 week ago
Question
Answered: 1 week ago
Question
Answered: 1 week ago
Question
Answered: 1 week ago
Question
Answered: 1 week ago
Question
Answered: 1 week ago
Question
Answered: 1 week ago
View Answer in SolutionInn App


