

Answered step by step
Verified Expert Solution
Question
1 Approved Answer
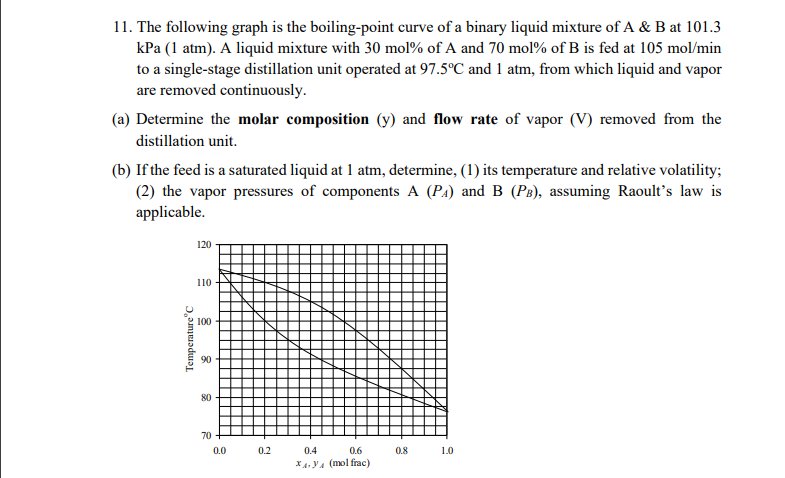
11. The following graph is the boiling-point curve of a binary liquid mixture of A & B at 101.3 kPa (1 atm). A liquid mixture
Step by Step Solution
There are 3 Steps involved in it
Step: 1

Get Instant Access to Expert-Tailored Solutions
See step-by-step solutions with expert insights and AI powered tools for academic success
Step: 2

Step: 3
Ace Your Homework with AI
Get the answers you need in no time with our AI-driven, step-by-step assistance
Get Started
Elements Of Chemical Reaction Engineering
Authors: H. Fogler
6th Edition
013548622X, 978-0135486221