12 schools were ranked based on student satisfaction. Their scores range from 0 to 110 are listed below: 104 108.5 98.3 101.2 103 95.9 109.1
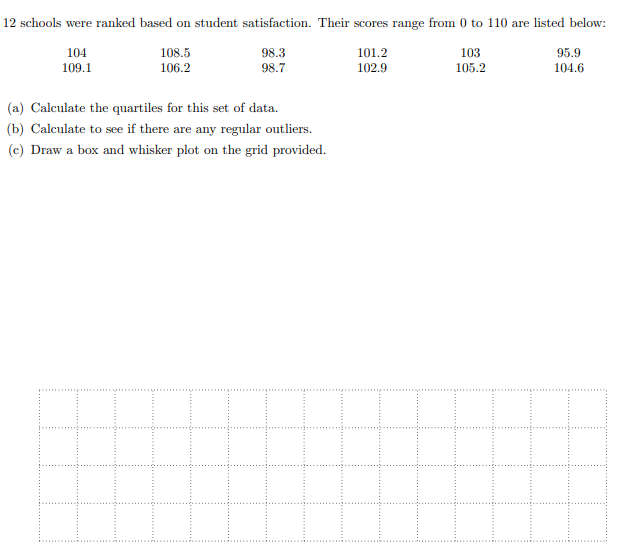
12 schools were ranked based on student satisfaction. Their scores range from 0 to 110 are listed below: 104 108.5 98.3 101.2 103 95.9 109.1 106.2 98.7 102.9 105.2 104.6 (a) Calculate the quartiles for this set of data. (b) Calculate to see if there are any regular outliers. (c) Draw a box and whisker plot on the grid provided
Step by Step Solution
There are 3 Steps involved in it
Step: 1
Get Instant Access to Expert-Tailored Solutions
See step-by-step solutions with expert insights and AI powered tools for academic success
Step: 2
Step: 3
Ace Your Homework with AI
Get the answers you need in no time with our AI-driven, step-by-step assistance