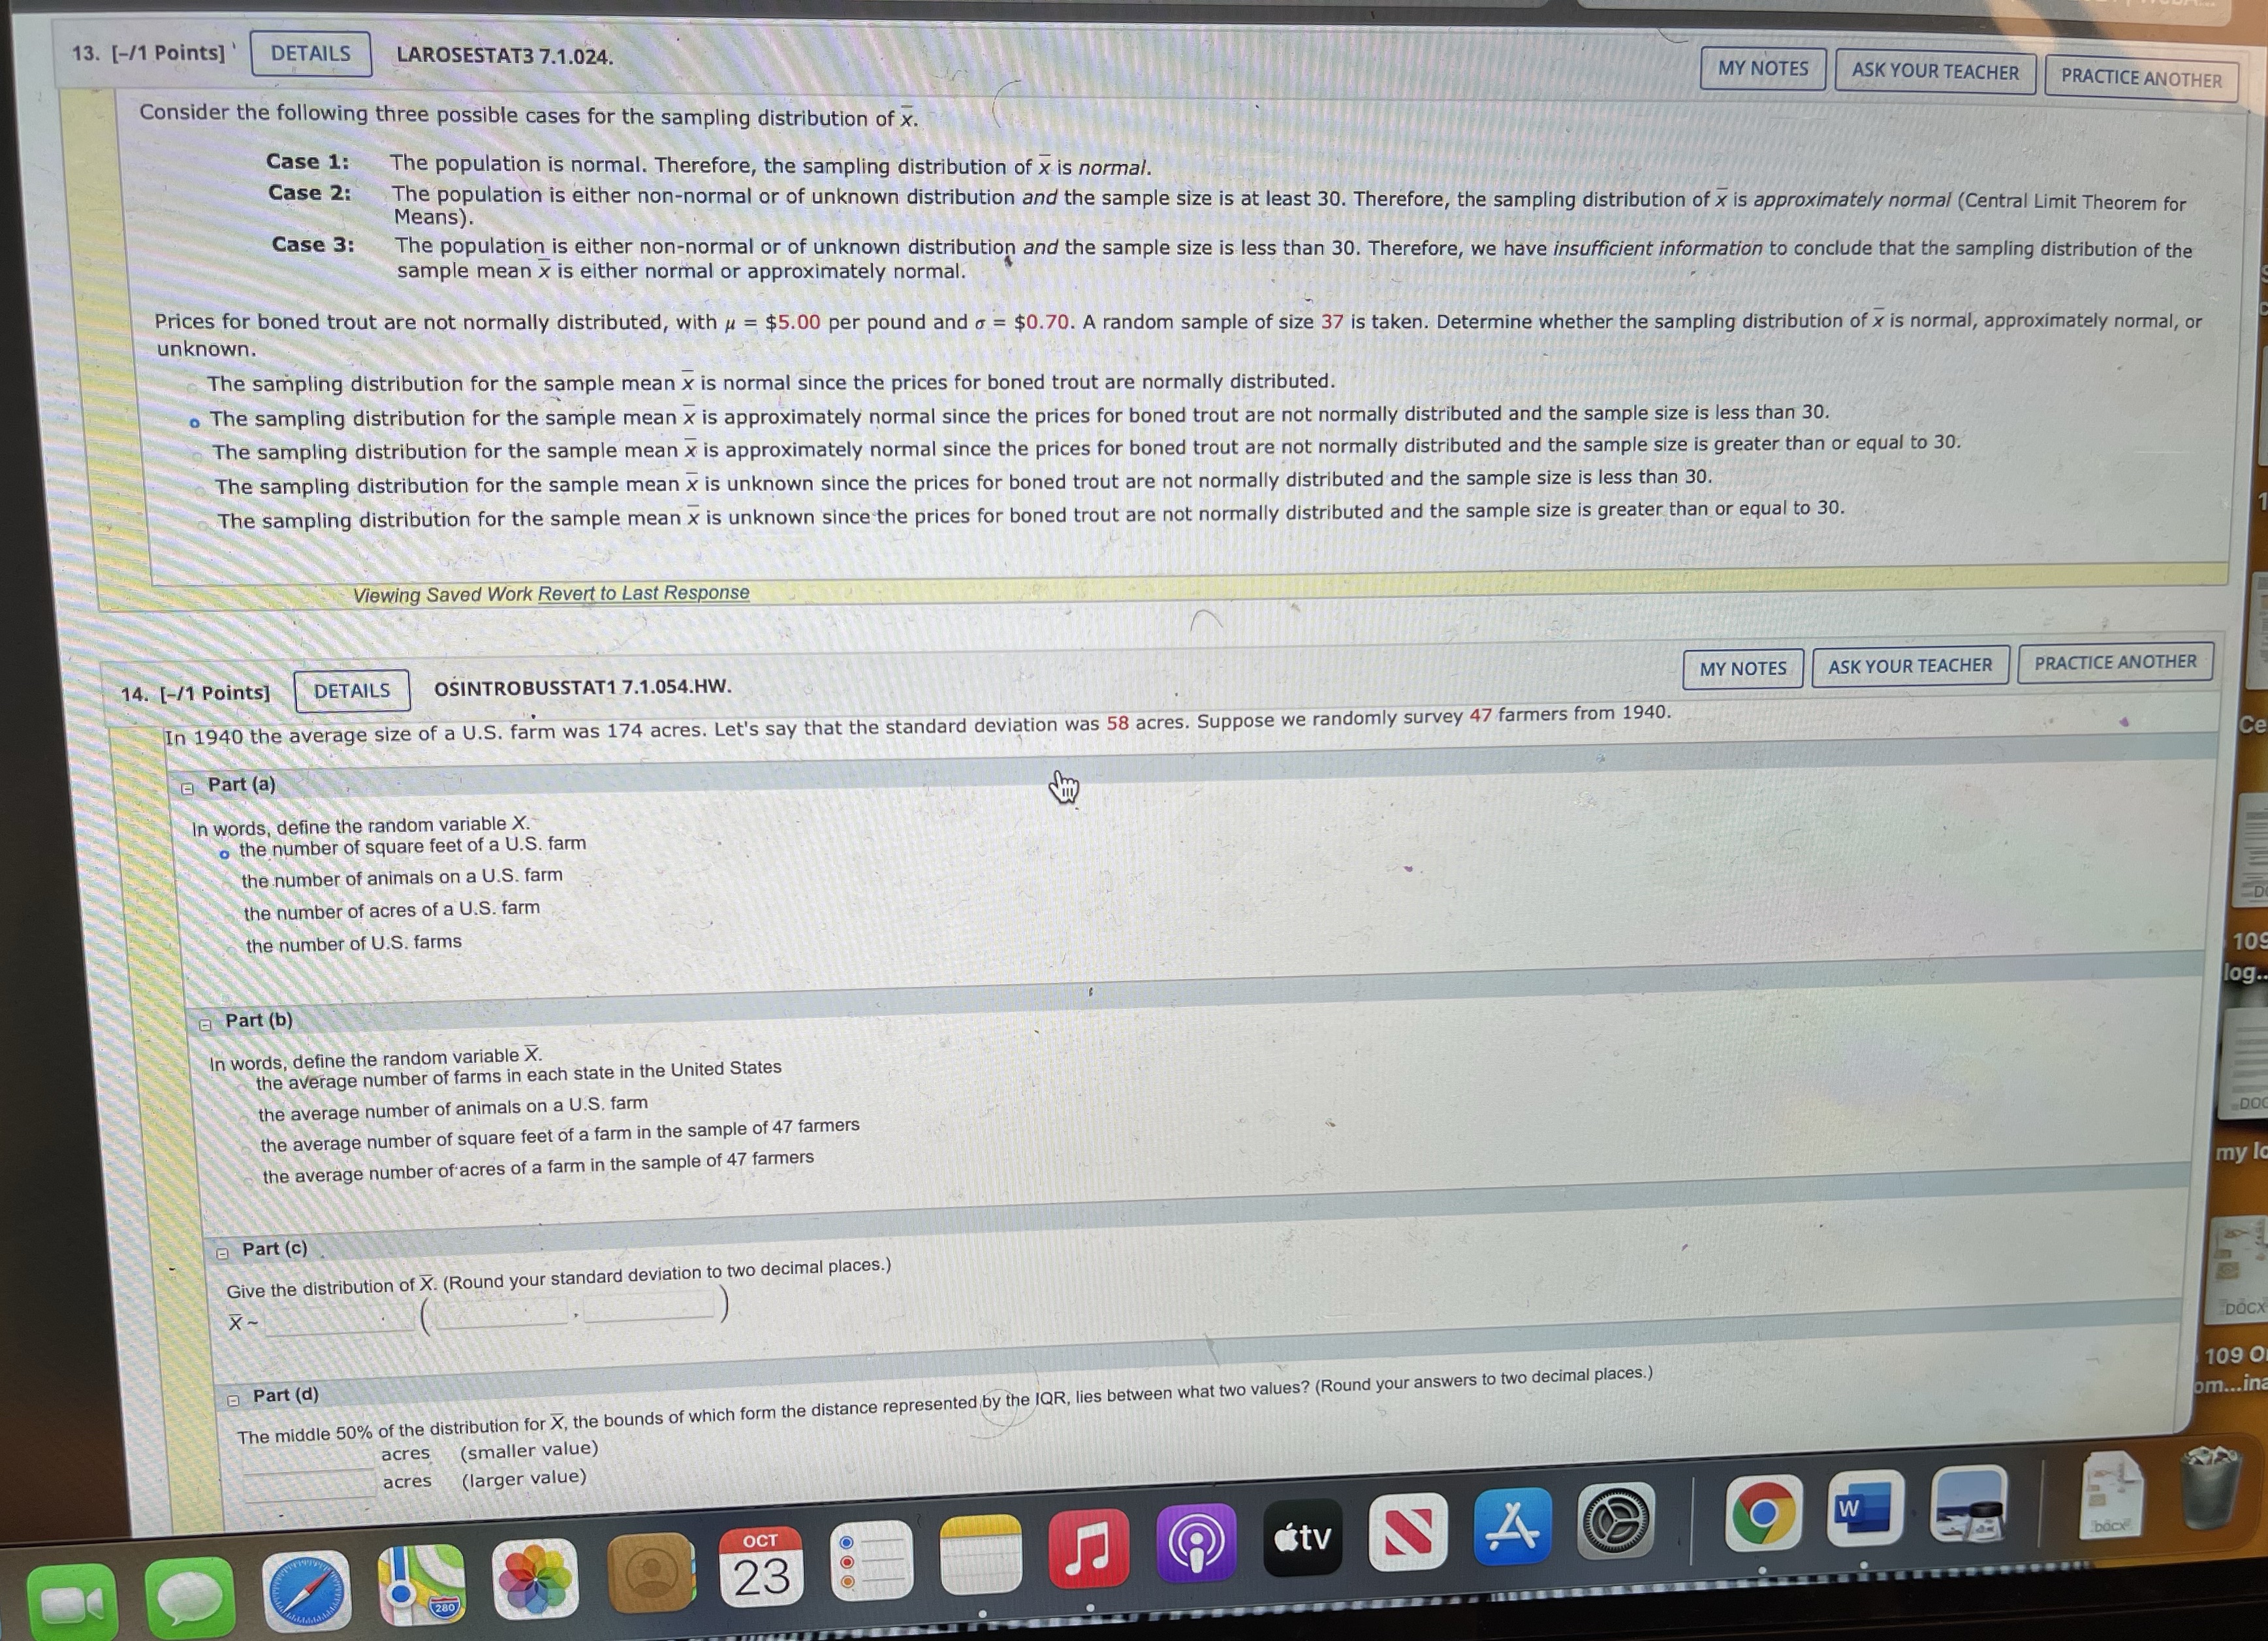
13. [-/1 Points] DETAILS LAROSESTAT3 7.1.024. MY NOTES ASK YOUR TEACHER Consider the following three possible cases for the sampling distribution of x. PRACTICE ANOTHER Case 1: The population is normal. Therefore, the sampling distribution of x is normal. Case 2: Means). The population is either non-normal or of unknown distribution and the sample size is at least 30. Therefore, the sampling distribution of x is approximately normal (Central Limit Theorem for Case 3: The population is either non-normal or of unknown distribution and the sample size is less than 30. Therefore, we have insufficient information to conclude that the sampling distribution of the sample mean x is either normal or approximately normal. unknown. Prices for boned trout are not normally distributed, with , = $5.00 per pound and o = $0.70. A random sample of size 37 is taken. Determine whether the sampling distribution of x is normal, approximately normal, or The sampling distribution for the sample mean x is normal since the prices for boned trout are normally distributed. o The sampling distribution for the sample mean x is approximately normal since the prices for boned trout are not normally distributed and the sample size is less than 30. The sampling distribution for the sample mean x is approximately normal since the prices for boned trout are not normally distributed and the sample size is greater than or equal to 30. The sampling distribution for the sample mean x is unknown since the prices for boned trout are not normally distributed and the sample size is less than 30. The sampling distribution for the sample mean x is unknown since the prices for boned trout are not normally distributed and the sample size is greater than or equal to 30. Viewing Saved Work Revert to Last Response 14. [-/1 Points] DETAILS OSINTROBUSSTAT1 7.1.054.HW. MY NOTES ASK YOUR TEACHER PRACTICE ANOTHER In 1940 the average size of a U.S. farm was 174 acres. Let's say that the standard deviation was 58 acres. Suppose we randomly survey 47 farmers from 1940. Part (a) In words, define the random variable X. o the number of square feet of a U.S. farm the number of animals on a U.S. farm the number of acres of a U.S. farm the number of U.S. farms 109 Part (b) log. In words, define the random variable X. the average number of farms in each state in the United States the average number of animals on a U.S, farm the average number of square feet of a farm in the sample of 47 farmers DO the average number of acres of a farm in the sample of 47 farmers my Part (c) Give the distribution of X. (Round your standard deviation to two decimal places.) X - DOCX Part (d) 109 0 The middle 50% of the distribution for X, the bounds of which form the distance represented by the IQR, lies between what two values? (Round your answers to two decimal places.) m...in acres (smaller value) acres (larger value) OCT 23 itv 4 book


