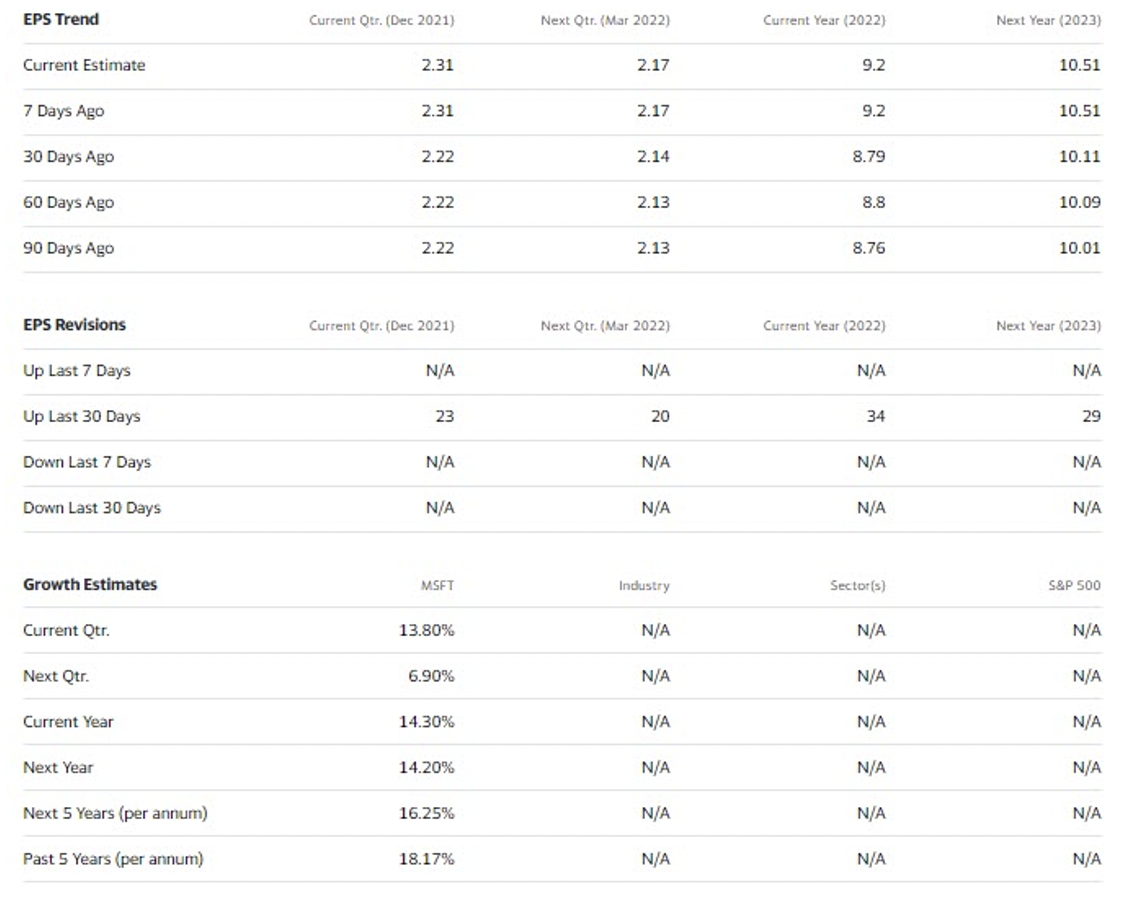
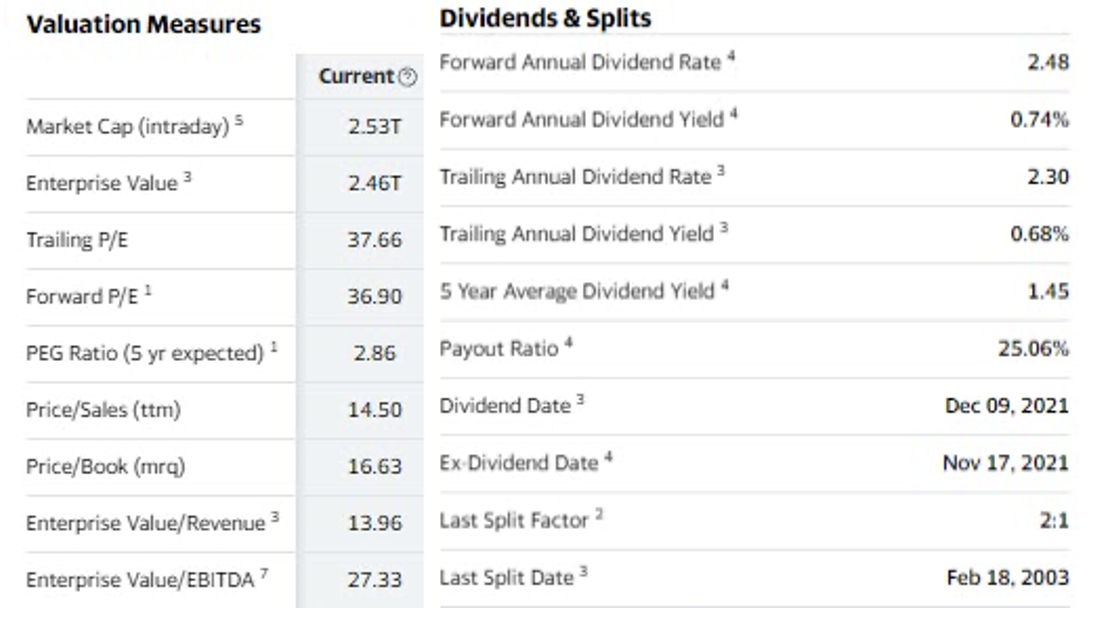
15-13 The data below is for Microsoft Corporation as of November 15, 2021. It closed at a price of $336.07. (3 points)


- Modeled P/E Ratio if the cost of equity capital is 18.75%.
- Return to Investor
- Would you buy this stock today and why or why not?
EPS Trend Current Otr. (Dec 2021) Next Otr. (Mar 2022) Current Year (2022) Next Year (2023) Current Estimate 2.31 2.17 9.2 10.51 7 Days Ago 2.31 2.17 9.2 10.51 30 Days Ago 2.22 2.14 8.79 10.11 60 Days Ago 2.22 2.13 8.8 10.09 90 Days Ago 2.22 2.13 8.76 10.01 EPS Revisions Current Otr. (Dec 2021) Next Qtr. (Mar 2022) Current Year (2022) Next Year (2023) Up Last 7 Days N/A N/A N/A N/A Up Last 30 Days 23 20 34 29 Down Last 7 Days N/A N/A N/A N/A Down Last 30 Days N/A N/A N/A N/A Growth Estimates MSFT Industry Sector(s) S&P 500 Current Otr. 13.80% N/A N/A N/A Next Qtr. 6.90% N/A N/A N/A Current Year 14.30% N/A N/A N/A Next Year 14.20% N/A N/A N/A Next 5 Years (per annum) 16.25% N/A N/A N/A Past 5 Years (per annum) 18.17% N/A N/A N/A Valuation Measures 2.48 Current 2.53T Dividends & Splits Forward Annual Dividend Rate * Forward Annual Dividend Yield" Trailing Annual Dividend Rate 3 Trailing Annual Dividend Yield 3 Market Cap (intraday) Enterprise Value> Trailing P/E 0.74% 2.46T 2.30 37.66 0.68% Forward P/E 1 36.90 5 Year Average Dividend Yield" 1.45 PEG Ratio (5 yr expected) 1 2.86 Payout Ratio 25.06% Price/Sales (tt) 14.50 Dividend Date Dec 09, 2021 Price/Book (mra) 16.63 Ex Dividend Date Nov 17, 2021 Enterprise Value/Revenue 3 13.96 Last Split Factor 2 2:1 Enterprise Value/EBITDA 27.33 Last Split Date Feb 18, 2003 EPS Trend Current Otr. (Dec 2021) Next Otr. (Mar 2022) Current Year (2022) Next Year (2023) Current Estimate 2.31 2.17 9.2 10.51 7 Days Ago 2.31 2.17 9.2 10.51 30 Days Ago 2.22 2.14 8.79 10.11 60 Days Ago 2.22 2.13 8.8 10.09 90 Days Ago 2.22 2.13 8.76 10.01 EPS Revisions Current Otr. (Dec 2021) Next Qtr. (Mar 2022) Current Year (2022) Next Year (2023) Up Last 7 Days N/A N/A N/A N/A Up Last 30 Days 23 20 34 29 Down Last 7 Days N/A N/A N/A N/A Down Last 30 Days N/A N/A N/A N/A Growth Estimates MSFT Industry Sector(s) S&P 500 Current Otr. 13.80% N/A N/A N/A Next Qtr. 6.90% N/A N/A N/A Current Year 14.30% N/A N/A N/A Next Year 14.20% N/A N/A N/A Next 5 Years (per annum) 16.25% N/A N/A N/A Past 5 Years (per annum) 18.17% N/A N/A N/A Valuation Measures 2.48 Current 2.53T Dividends & Splits Forward Annual Dividend Rate * Forward Annual Dividend Yield" Trailing Annual Dividend Rate 3 Trailing Annual Dividend Yield 3 Market Cap (intraday) Enterprise Value> Trailing P/E 0.74% 2.46T 2.30 37.66 0.68% Forward P/E 1 36.90 5 Year Average Dividend Yield" 1.45 PEG Ratio (5 yr expected) 1 2.86 Payout Ratio 25.06% Price/Sales (tt) 14.50 Dividend Date Dec 09, 2021 Price/Book (mra) 16.63 Ex Dividend Date Nov 17, 2021 Enterprise Value/Revenue 3 13.96 Last Split Factor 2 2:1 Enterprise Value/EBITDA 27.33 Last Split Date Feb 18, 2003


