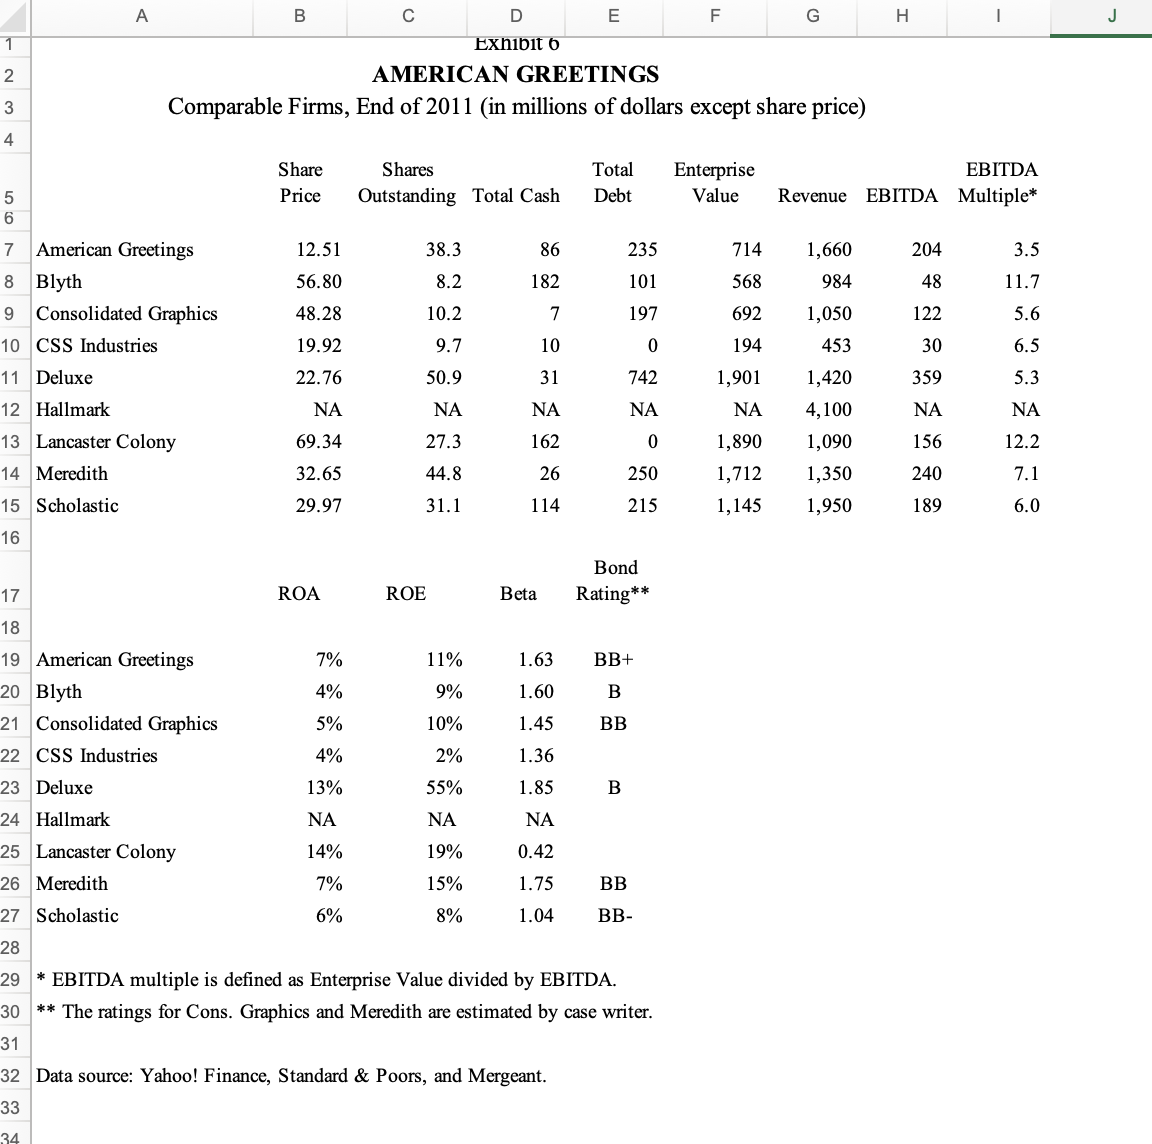
 1.The shares of American Greetings (AG) are currently trading at an EBITDA multiple that is at the bottom of its peer group. Do you think 3.5 times multiple is appropriate for AG? If not, what multiple of EBITDA do you think is justified? What is the implied share price that corresponds to that multiplier?
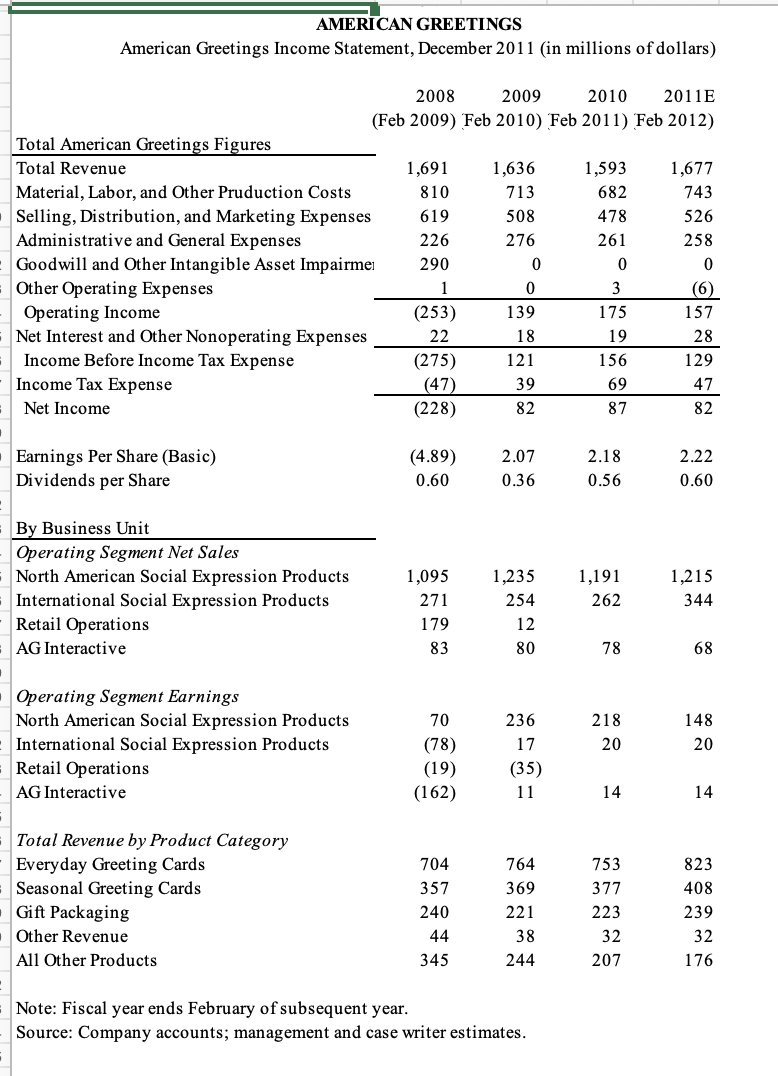
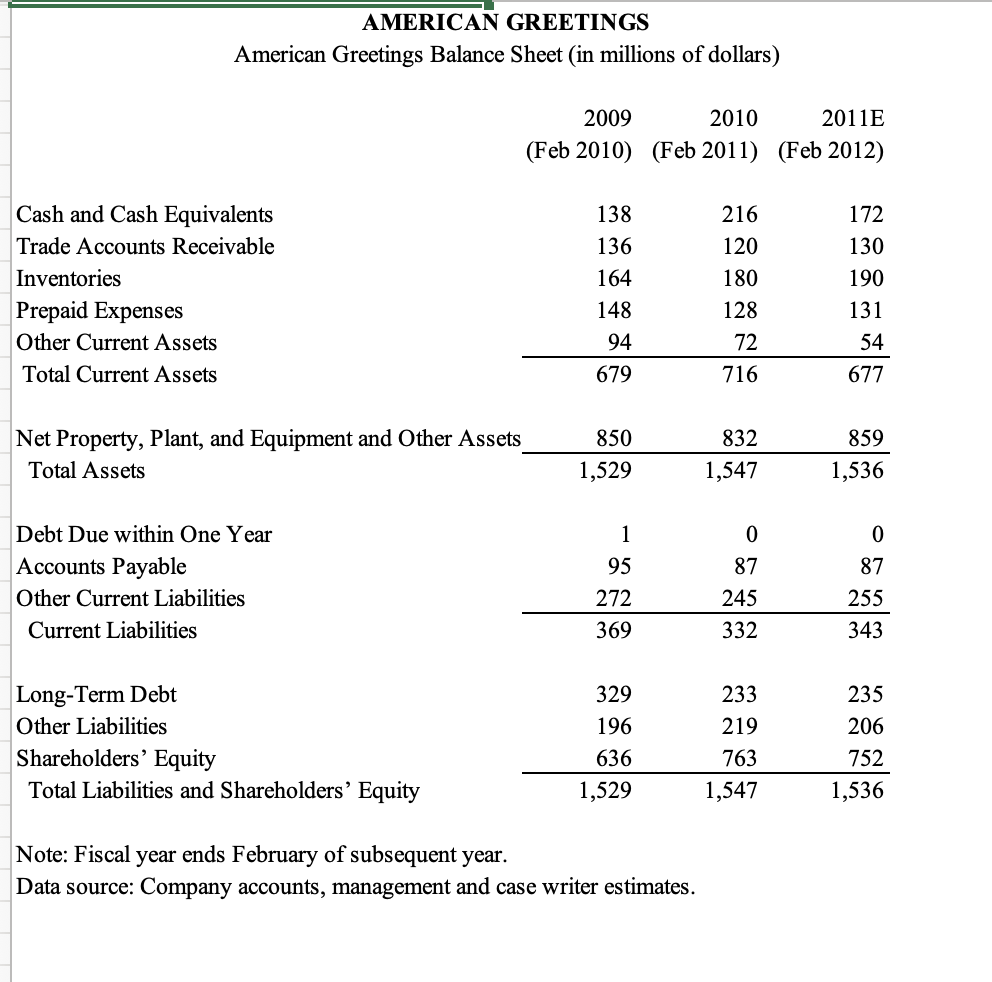
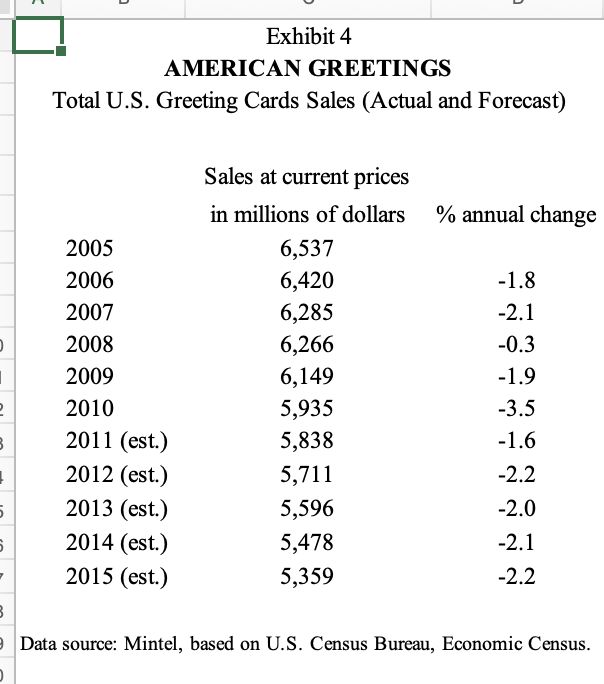
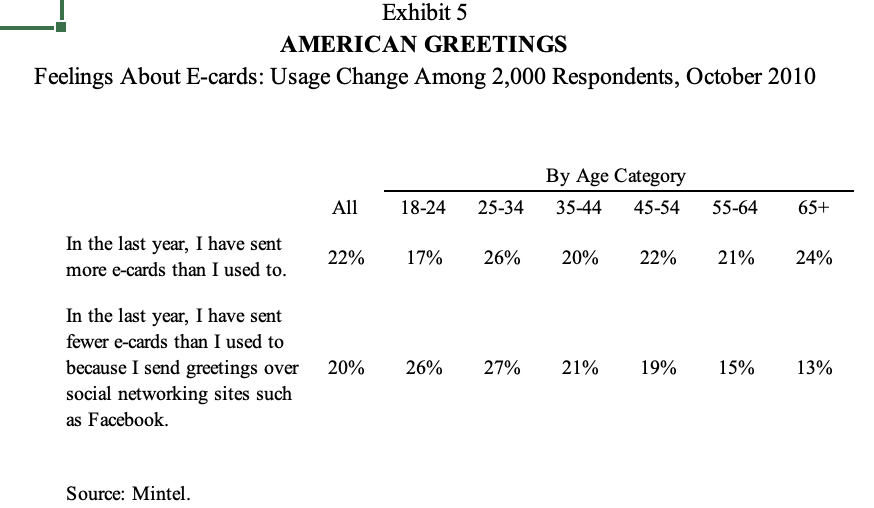
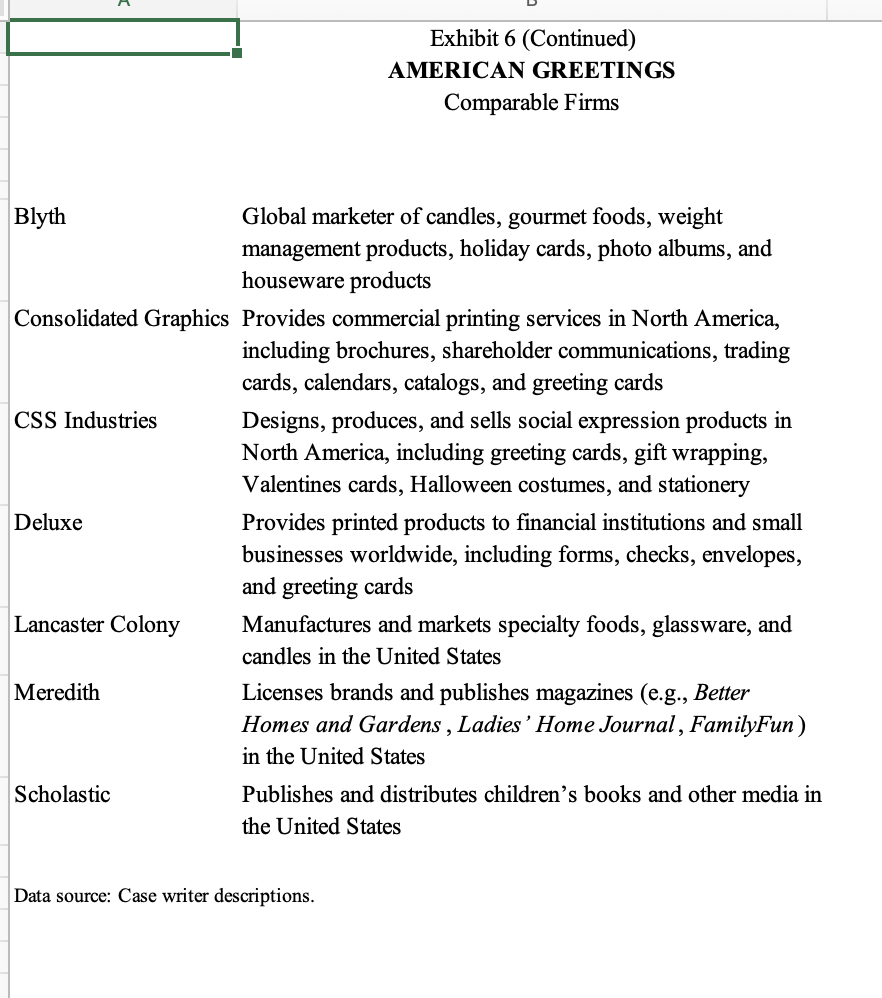
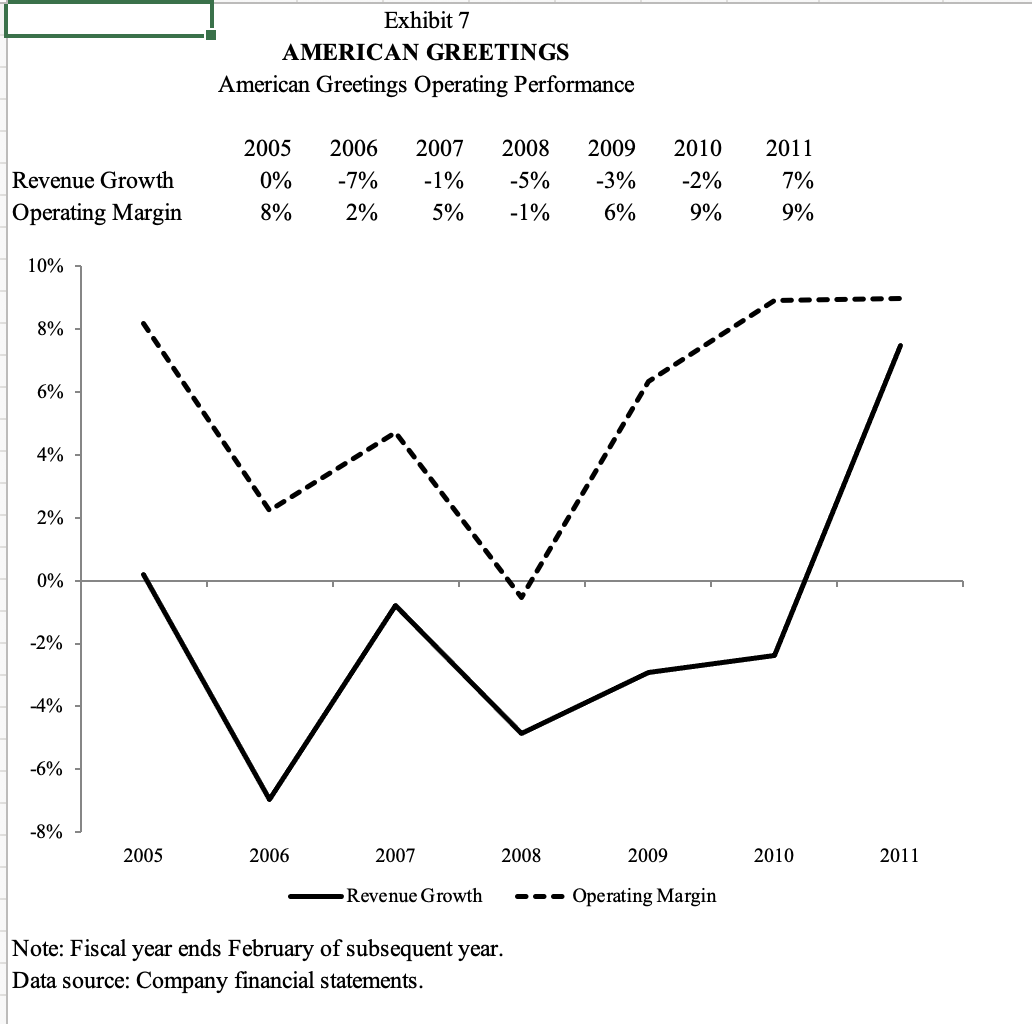
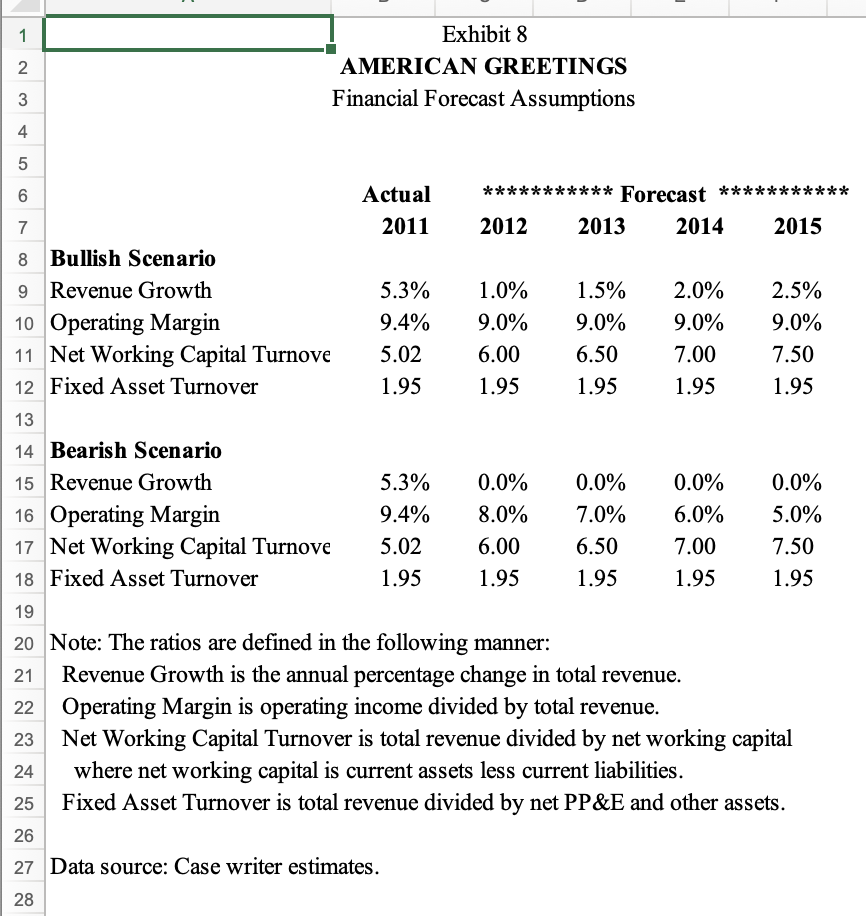
Note: Fiscal year ends February of subsequent year. Source: Company accounts; management and case writer estimates. Note: Fiscal year ends February of subsequent year. Data source: Company accounts, management and case writer estimates. Data source: Mintel, based on U.S. Census Bureau, Economic Census. Exhibit 5 AMERICAN GREETINGS Feelings About E-cards: Usage Change Among 2,000 Respondents, October 2010 A N/DDI ATCD ** The ratings for Cons. Graphics and Meredith are estimated by case writer. Data source: Yahoo! Finance, Standard \& Poors, and Mergeant. Blyth Global marketer of candles, gourmet foods, weight management products, holiday cards, photo albums, and houseware products Consolidated Graphics Provides commercial printing services in North America, including brochures, shareholder communications, trading cards, calendars, catalogs, and greeting cards CSS Industries Deluxe Lancaster Colony Meredith Scholastic Designs, produces, and sells social expression products in North America, including greeting cards, gift wrapping, Valentines cards, Halloween costumes, and stationery Provides printed products to financial institutions and small businesses worldwide, including forms, checks, envelopes, and greeting cards Manufactures and markets specialty foods, glassware, and candles in the United States Licenses brands and publishes magazines (e.g., Better Homes and Gardens, Ladies' Home Journal, FamilyFun ) in the United States Publishes and distributes children's books and other media in the United States Data source: Case writer descriptions. Data source: Company financial statements. Note: The ratios are defined in the following manner: Revenue Growth is the annual percentage change in total revenue. Operating Margin is operating income divided by total revenue. Net Working Capital Turnover is total revenue divided by net working capital where net working capital is current assets less current liabilities. Fixed Asset Turnover is total revenue divided by net PP\&E and other assets. Data source: Case writer estimates. Note: Fiscal year ends February of subsequent year. Source: Company accounts; management and case writer estimates. Note: Fiscal year ends February of subsequent year. Data source: Company accounts, management and case writer estimates. Data source: Mintel, based on U.S. Census Bureau, Economic Census. Exhibit 5 AMERICAN GREETINGS Feelings About E-cards: Usage Change Among 2,000 Respondents, October 2010 A N/DDI ATCD ** The ratings for Cons. Graphics and Meredith are estimated by case writer. Data source: Yahoo! Finance, Standard \& Poors, and Mergeant. Blyth Global marketer of candles, gourmet foods, weight management products, holiday cards, photo albums, and houseware products Consolidated Graphics Provides commercial printing services in North America, including brochures, shareholder communications, trading cards, calendars, catalogs, and greeting cards CSS Industries Deluxe Lancaster Colony Meredith Scholastic Designs, produces, and sells social expression products in North America, including greeting cards, gift wrapping, Valentines cards, Halloween costumes, and stationery Provides printed products to financial institutions and small businesses worldwide, including forms, checks, envelopes, and greeting cards Manufactures and markets specialty foods, glassware, and candles in the United States Licenses brands and publishes magazines (e.g., Better Homes and Gardens, Ladies' Home Journal, FamilyFun ) in the United States Publishes and distributes children's books and other media in the United States Data source: Case writer descriptions. Data source: Company financial statements. Note: The ratios are defined in the following manner: Revenue Growth is the annual percentage change in total revenue. Operating Margin is operating income divided by total revenue. Net Working Capital Turnover is total revenue divided by net working capital where net working capital is current assets less current liabilities. Fixed Asset Turnover is total revenue divided by net PP\&E and other assets. Data source: Case writer estimates