Answered step by step
Verified Expert Solution
Question
1 Approved Answer
#2 #1: Current sales trend is +8.8% versus last year Project sales, stocks, MDs, shortage and purchases based on current sales trend Orange highlighted BOM
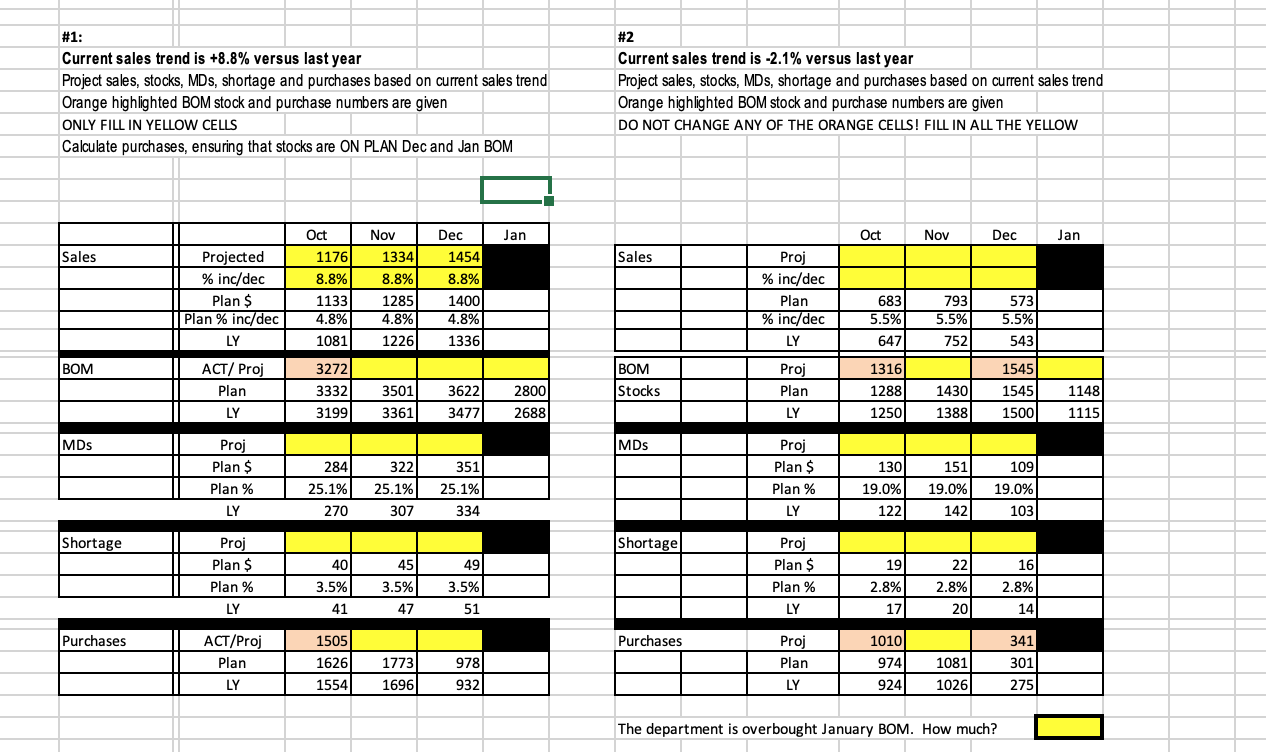
#2 #1: Current sales trend is +8.8% versus last year Project sales, stocks, MDs, shortage and purchases based on current sales trend Orange highlighted BOM stock and purchase numbers are given ONLY FILL IN YELLOW CELLS Calculate purchases, ensuring that stocks are ON PLAN Dec and Jan BOM Current sales trend is -2.1% versus last year Project sales, stocks, MDs, shortage and purchases based on current sales trend Orange highlighted BOM stock and purchase numbers are given DO NOT CHANGE ANY OF THE ORANGE CELLS! FILL IN ALL THE YELLOW Jan Oct Nov Dec Jan Sales Sales Projected % inc/dec Plan $ Plan % inc/dec LY Oct 1176 8.8% 1133 4.8% 1081) 3272 33321 3199 Nov Dec 1334 1454 8.8% 8.8% 1285 14001 4.8% 4.8% 12261336 Proj % inc/dec Plan % inc/dec 573 683 5.5% 647 793 5.5% 752 543 BOM ACT/ Proj 1316 1545 Plan | Stocks 3501 3361 3622| 3477 2800 2688 Proj Plan LY 1288 1250 1430 1388 1545 1500 1148 1115 LY MDs MDs Proj Plan $ Plan % 284 25.1% 270 322 25.1% 307 351 25.1% 334 Proj Plan $ Plan % | LY | | 130 19.0% 122| 151 19.0% 142 109 19.0% 103 LY LY Shortage Shortage Proj Plan $ Plan % LY 40 3.5% 41 45 3.5% 47 49 3.5% 51 Proj Plan $ Plan % LLY 19 2.8% 17 22 16 2.8% 2.8% 2014 1 Purchases | Purchases ACT/Proj Plan LY 1505 1626 1554) 1773 16961 978 932 Proj Plan 1 LY 1010 974 924 1081) 1026 341 301 275 L The department is overbought January BOM. How much? #2 #1: Current sales trend is +8.8% versus last year Project sales, stocks, MDs, shortage and purchases based on current sales trend Orange highlighted BOM stock and purchase numbers are given ONLY FILL IN YELLOW CELLS Calculate purchases, ensuring that stocks are ON PLAN Dec and Jan BOM Current sales trend is -2.1% versus last year Project sales, stocks, MDs, shortage and purchases based on current sales trend Orange highlighted BOM stock and purchase numbers are given DO NOT CHANGE ANY OF THE ORANGE CELLS! FILL IN ALL THE YELLOW Jan Oct Nov Dec Jan Sales Sales Projected % inc/dec Plan $ Plan % inc/dec LY Oct 1176 8.8% 1133 4.8% 1081) 3272 33321 3199 Nov Dec 1334 1454 8.8% 8.8% 1285 14001 4.8% 4.8% 12261336 Proj % inc/dec Plan % inc/dec 573 683 5.5% 647 793 5.5% 752 543 BOM ACT/ Proj 1316 1545 Plan | Stocks 3501 3361 3622| 3477 2800 2688 Proj Plan LY 1288 1250 1430 1388 1545 1500 1148 1115 LY MDs MDs Proj Plan $ Plan % 284 25.1% 270 322 25.1% 307 351 25.1% 334 Proj Plan $ Plan % | LY | | 130 19.0% 122| 151 19.0% 142 109 19.0% 103 LY LY Shortage Shortage Proj Plan $ Plan % LY 40 3.5% 41 45 3.5% 47 49 3.5% 51 Proj Plan $ Plan % LLY 19 2.8% 17 22 16 2.8% 2.8% 2014 1 Purchases | Purchases ACT/Proj Plan LY 1505 1626 1554) 1773 16961 978 932 Proj Plan 1 LY 1010 974 924 1081) 1026 341 301 275 L The department is overbought January BOM. How much
Step by Step Solution
There are 3 Steps involved in it
Step: 1
Get Instant Access to Expert-Tailored Solutions
See step-by-step solutions with expert insights and AI powered tools for academic success
Step: 2
Step: 3
Ace Your Homework with AI
Get the answers you need in no time with our AI-driven, step-by-step assistance
Get Started