Answered step by step
Verified Expert Solution
Link Copied!

Question

1 Approved Answer

2. [10 marks] Shown below are the height (x ) and shoe size (y ) for a random sample of 10 women. (You can copy
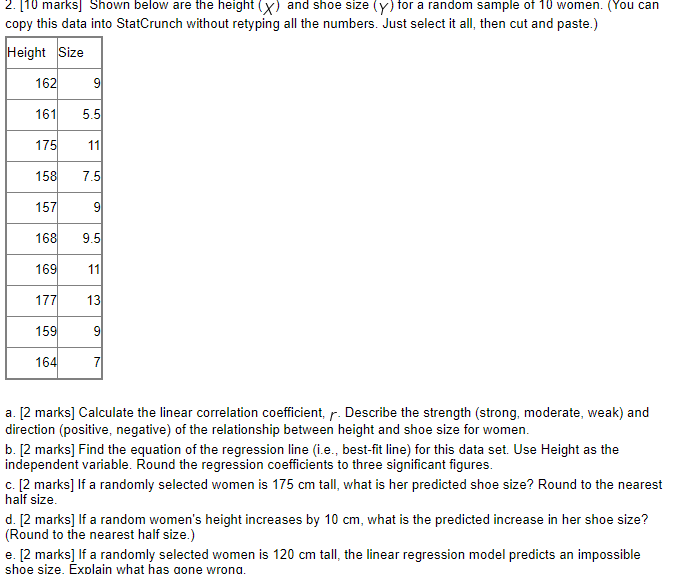
image text in transcribed
2. [10 marks] Shown below are the height (x ) and shoe size (y ) for a random sample of 10 women. (You can copy this data into StatCrunch without retyping all the numbers. Just select it all, then cut and paste.) Height Size 162 9 161 5.5 175 11 158 7.5 157 9 168 9.5 169 11 177 13 159 9 164 a. [2 marks] Calculate the linear correlation coefficient, /. Describe the strength (strong, moderate, weak) and direction (positive, negative) of the relationship between height and shoe size for women. b. [2 marks] Find the equation of the regression line (i.e., best-fit line) for this data set. Use Height as the independent variable. Round the regression coefficients to three significant figures. c. [2 marks] If a randomly selected women is 175 cm tall, what is her predicted shoe size? Round to the nearest half size. d. [2 marks] If a random women's height increases by 10 cm, what is the predicted increase in her shoe size? (Round to the nearest half size.) e. [2 marks] If a randomly selected women is 120 cm tall, the linear regression model predicts an impossible shoe size Explain what has(

Step by Step Solution

There are 3 Steps involved in it

Step: 1

blur-text-image

Get Instant Access to Expert-Tailored Solutions

See step-by-step solutions with expert insights and AI powered tools for academic success

Step: 2

blur-text-image_2

Step: 3

blur-text-image_3

Ace Your Homework with AI

Get the answers you need in no time with our AI-driven, step-by-step assistance

Get Started

Recommended Textbook for

Intermediate Algebra With Trigonometry

Authors: Charles P McKeague

1st Edition

1483218759, 9781483218755

More Books

Students also viewed these Mathematics questions