Question
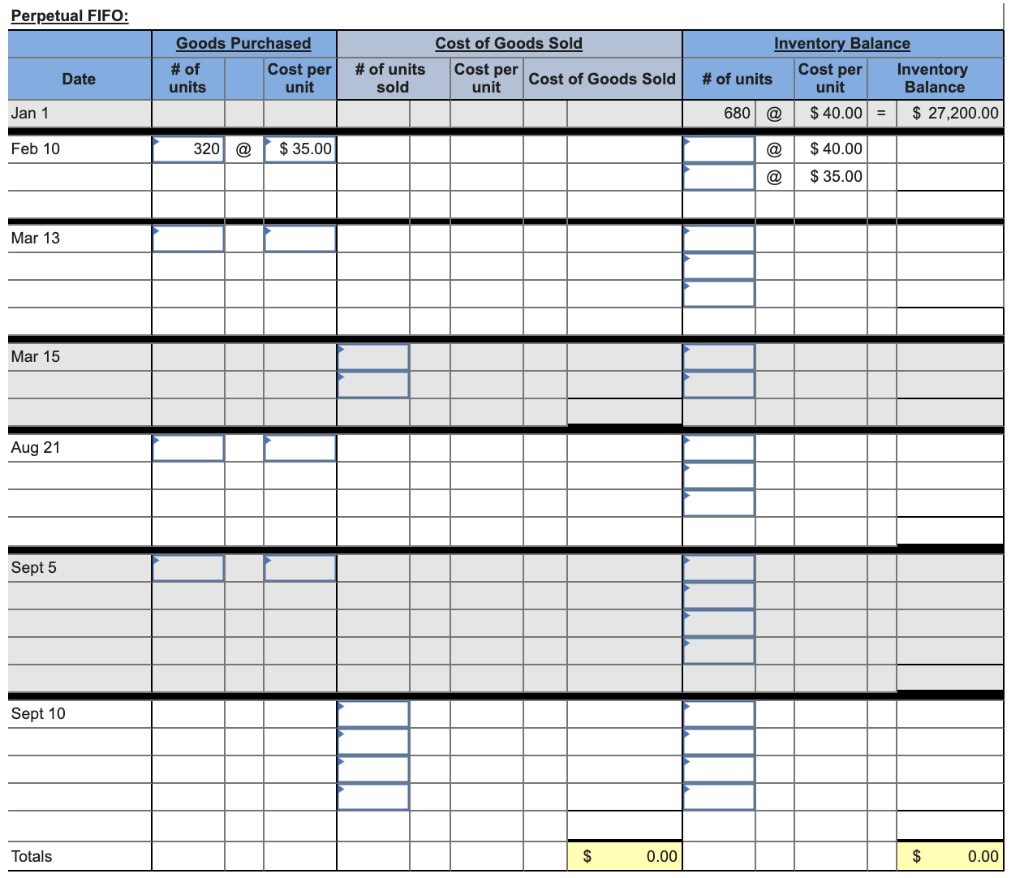
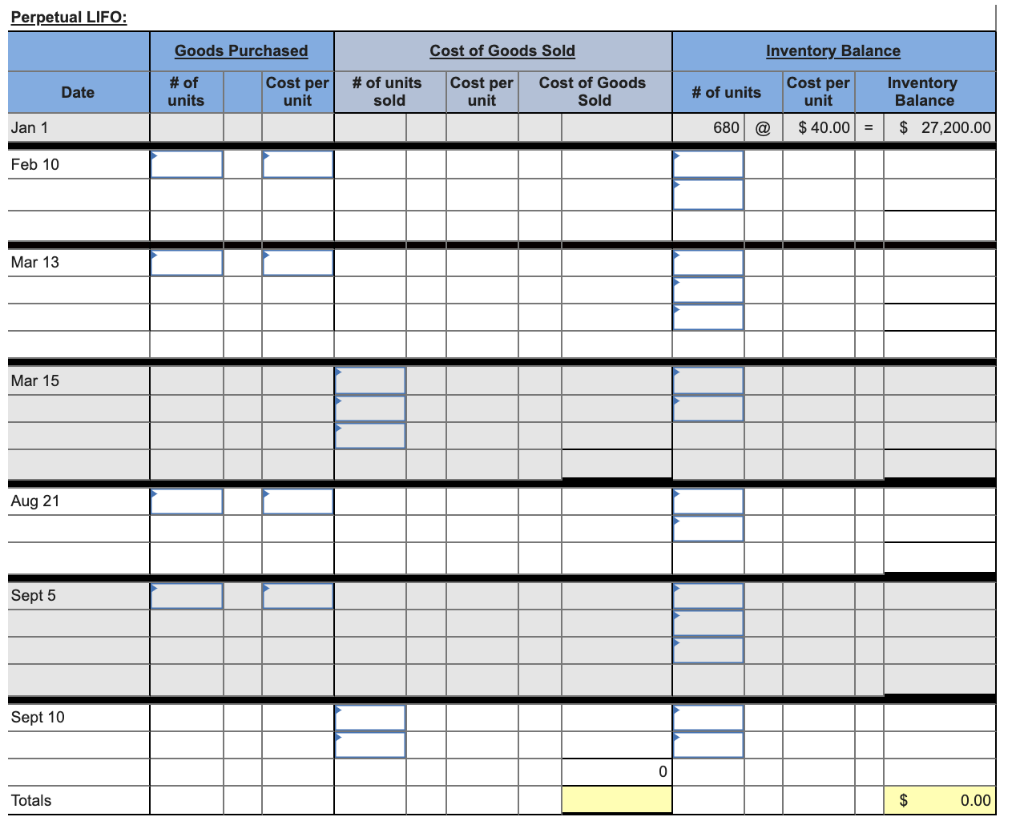
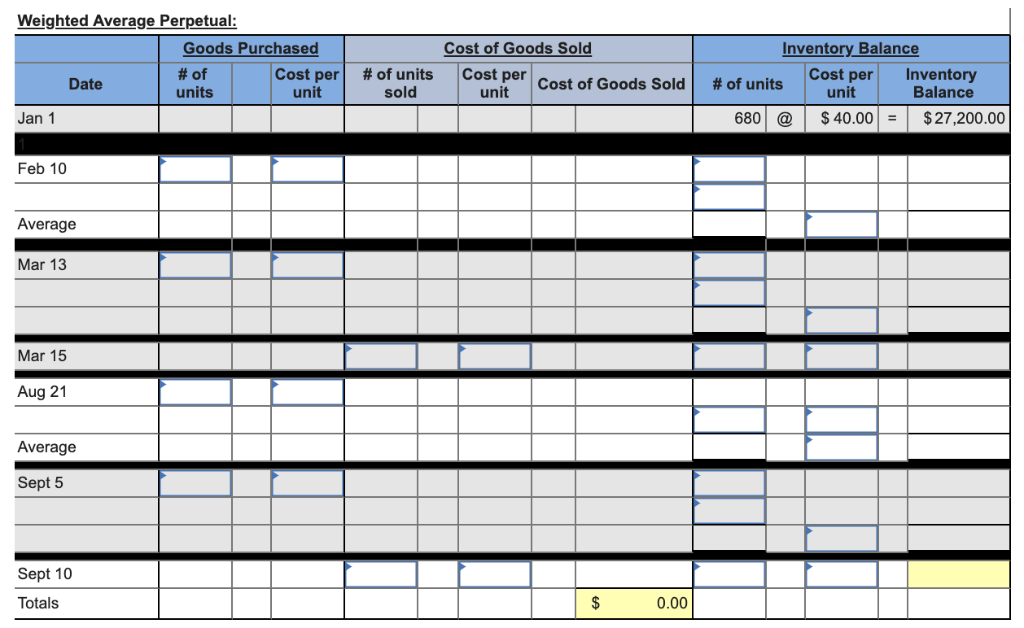
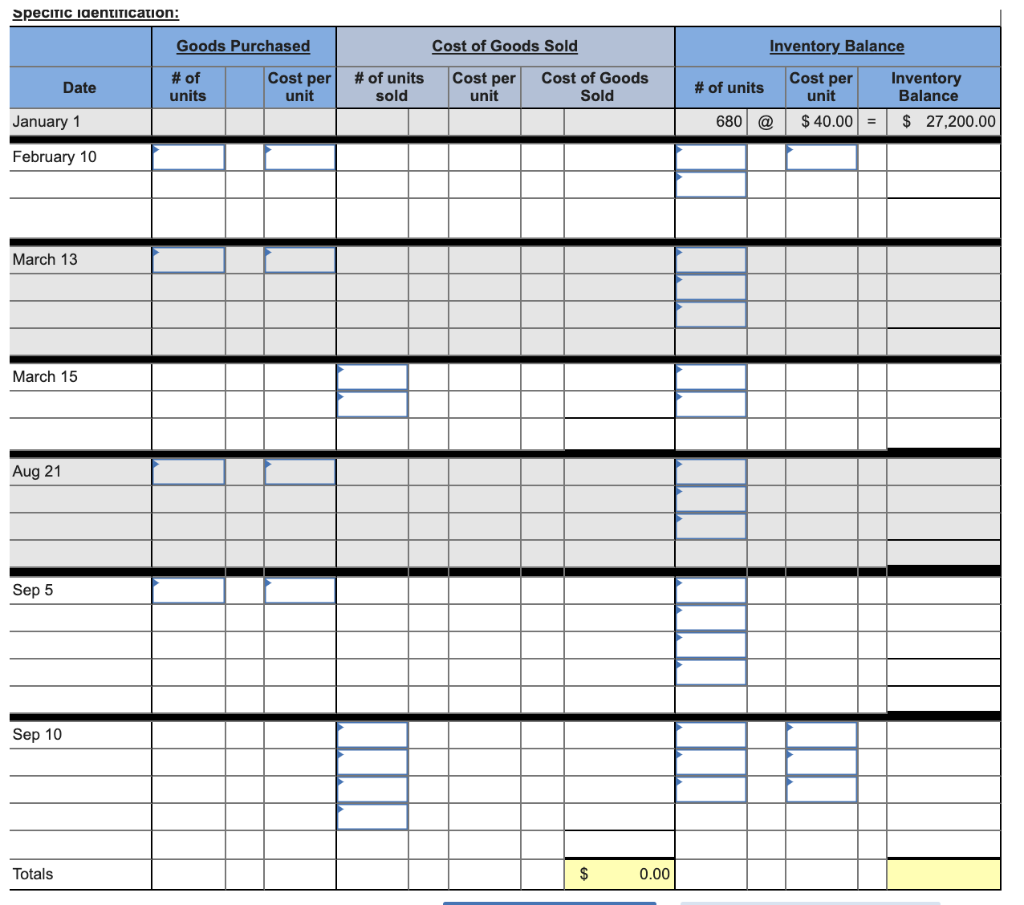
Problem 5-3A Perpetual: Alternative cost flows LO P1 Montoure Company uses a perpetual inventory system. It entered into the following calendar-year purchases and sales transactions
Problem 5-3A Perpetual: Alternative cost flows LO P1
Montoure Company uses a perpetual inventory system. It entered into the following calendar-year purchases and sales transactions
| Date | Activities | Units Acquired at Cost | Units Sold at Retail | |||||||||
| Jan. | 1 | Beginning inventory | 680 | units | @ $40 per unit | |||||||
| Feb. | 10 | Purchase | 320 | units | @ $35 per unit | |||||||
| Mar. | 13 | Purchase | 100 | units | @ $23 per unit | |||||||
| Mar. | 15 | Sales | 720 | units | @ $75 per unit | |||||||
| Aug. | 21 | Purchase | 130 | units | @ $45 per unit | |||||||
| Sept. | 5 | Purchase | 490 | units | @ $41 per unit | |||||||
| Sept. | 10 | Sales | 640 | units | @ $75 per unit | |||||||
| Totals | 1,720 | units | 1,360 | units | ||||||||
|
| ||||||||||||
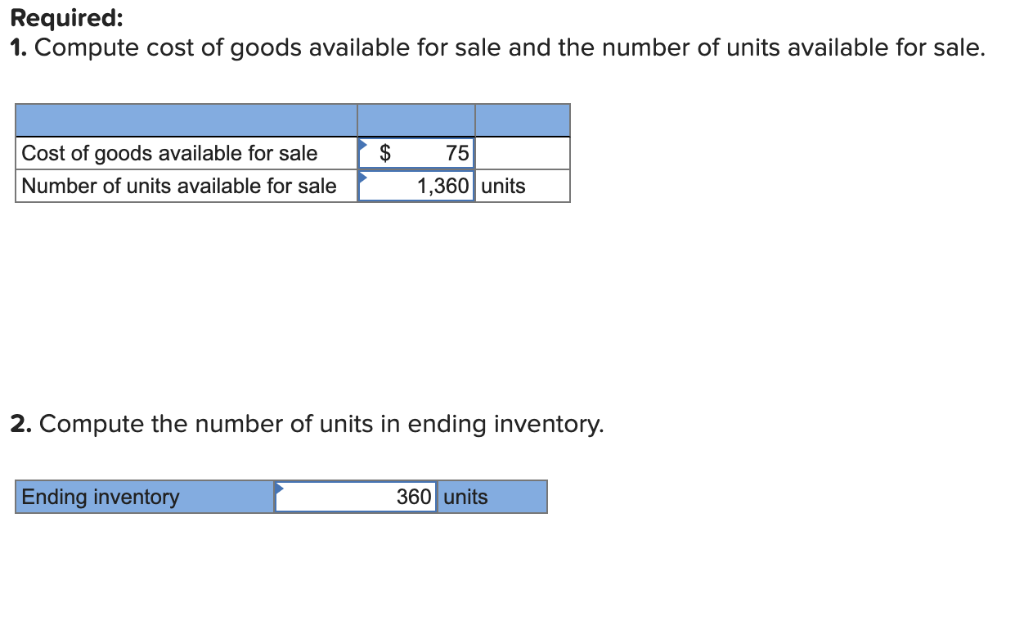
3. Compute the cost assigned to ending inventory using (a) FIFO, (b) LIFO, (c) weighted average, and (d) specific identification. For specific identification, units sold consist of 680 units from beginning inventory, 240 from the February 10 purchase, 100 from the March 13 purchase, 80 from the August 21 purchase, and 260 from the September 5 purchase. (Round your average cost per unit to 2 decimal places.)

Step by Step Solution
There are 3 Steps involved in it
Step: 1

Get Instant Access to Expert-Tailored Solutions
See step-by-step solutions with expert insights and AI powered tools for academic success
Step: 2

Step: 3

Ace Your Homework with AI
Get the answers you need in no time with our AI-driven, step-by-step assistance
Get Started


