

Answered step by step
Verified Expert Solution
Question
1 Approved Answer
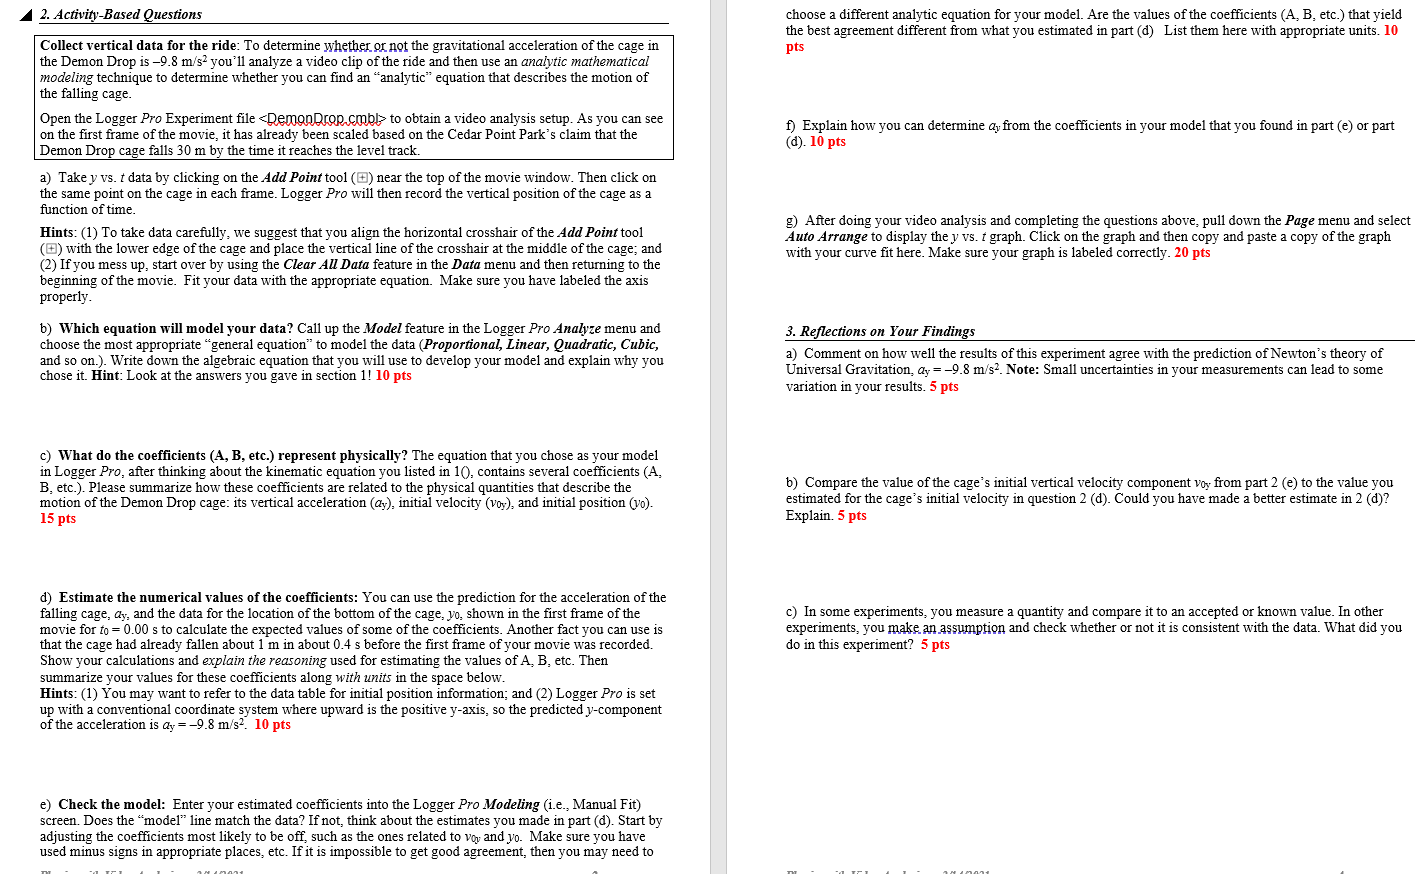
2. Activity-Based Questions choose a different analytic equation for your model. Are the values of the coefficients (A, B, etc.) that yield the best agreement
Step by Step Solution
There are 3 Steps involved in it
Step: 1

Get Instant Access to Expert-Tailored Solutions
See step-by-step solutions with expert insights and AI powered tools for academic success
Step: 2

Step: 3
Ace Your Homework with AI
Get the answers you need in no time with our AI-driven, step-by-step assistance
Get Started
Database Administrator Limited Edition
Authors: Martif Way
1st Edition
B0CGG89N8Z