

Answered step by step
Verified Expert Solution
Question
1 Approved Answer
Need help/tutoring with MATLAB code I'm stuck have tried everything. MATH 365 Homework 7 due 12 March 1) In class, we wrote code for Lagrange
Need help/tutoring with MATLAB code I'm stuck have tried everything.
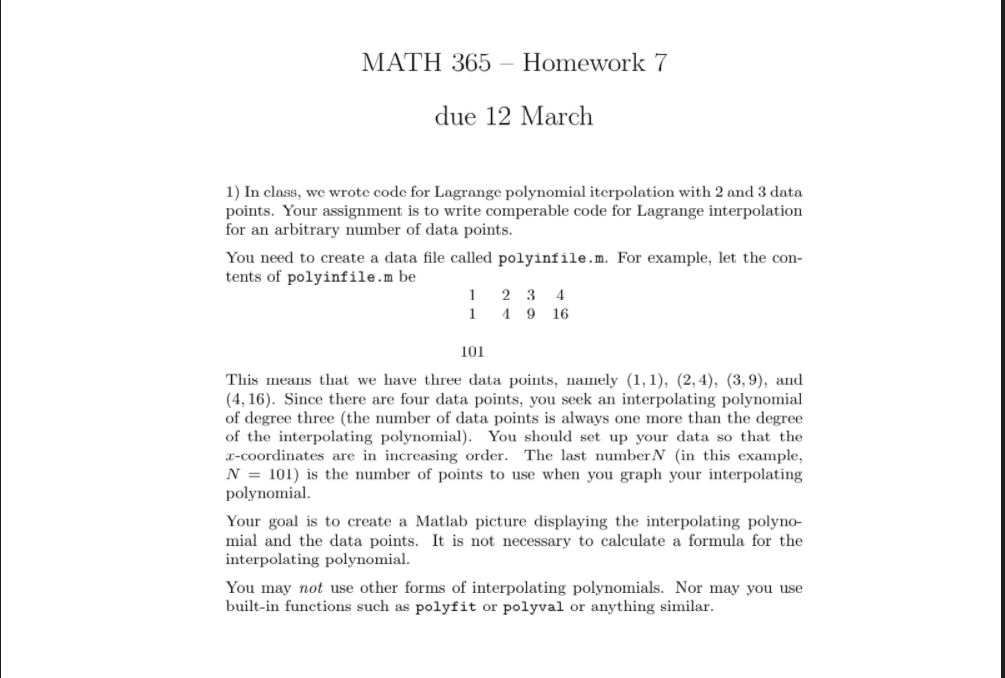
MATH 365 Homework 7 due 12 March 1) In class, we wrote code for Lagrange polynomial iterpolation with 2 and 3 data points. Your assignment is to write comperable code for Lagrange interpolation for an arbitrary number of data points. You need to create a data file called polyinfile.m. For example, let the con- tents of polyinfile.m be 1 3 1 1916 2 4 101 This means that we have three data points, namely (1,1), (2, 4), (3,9), and (4,16). Since there are four data points, you seek an interpolating polynomial of degree three (the number of data points is always one more than the degree of the interpolating polynomial). You should set up your data so that the 3-coordinates are in increasing order. The last number N (in this example, N = 101) is the number of points to use when you graph your interpolating polynomial. Your goal is to create a Matlab picture displaying the interpolating polyno- mial and the data points. It is not necessary to calculate a formula for the interpolating polynomial. You may not use other forms of interpolating polynomials. Nor may you use built-in functions such as polyfit or polyval or anything similar. MATH 365 Homework 7 due 12 March 1) In class, we wrote code for Lagrange polynomial iterpolation with 2 and 3 data points. Your assignment is to write comperable code for Lagrange interpolation for an arbitrary number of data points. You need to create a data file called polyinfile.m. For example, let the con- tents of polyinfile.m be 1 3 1 1916 2 4 101 This means that we have three data points, namely (1,1), (2, 4), (3,9), and (4,16). Since there are four data points, you seek an interpolating polynomial of degree three (the number of data points is always one more than the degree of the interpolating polynomial). You should set up your data so that the 3-coordinates are in increasing order. The last number N (in this example, N = 101) is the number of points to use when you graph your interpolating polynomial. Your goal is to create a Matlab picture displaying the interpolating polyno- mial and the data points. It is not necessary to calculate a formula for the interpolating polynomial. You may not use other forms of interpolating polynomials. Nor may you use built-in functions such as polyfit or polyval or anything similarStep by Step Solution
There are 3 Steps involved in it
Step: 1

Get Instant Access to Expert-Tailored Solutions
See step-by-step solutions with expert insights and AI powered tools for academic success
Step: 2

Step: 3
Ace Your Homework with AI
Get the answers you need in no time with our AI-driven, step-by-step assistance
Get Started
Database Administrator Limited Edition
Authors: Martif Way
1st Edition
B0CGG89N8Z