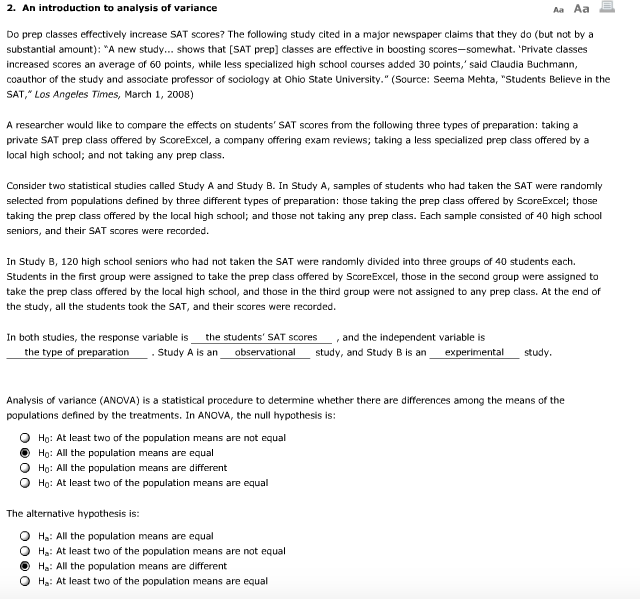
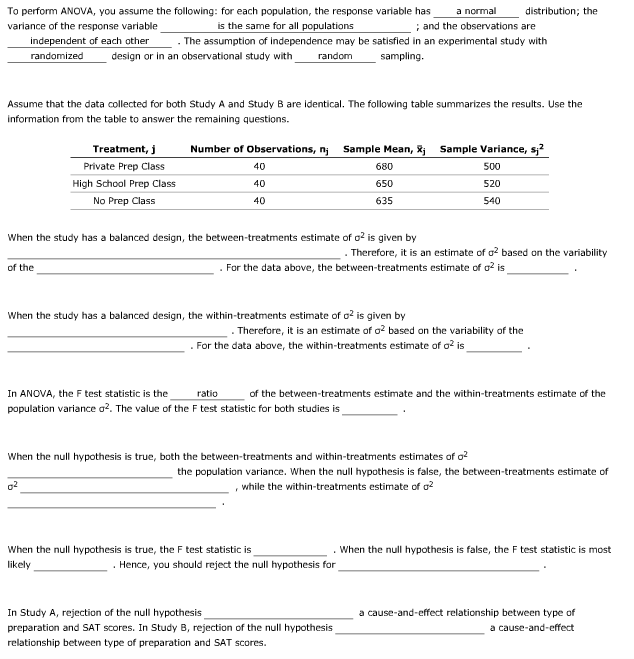
2. An introduction to analysis of variance As Aa Do prep classes effectively increase SAT scores? The following study cited in a major newspaper claims that they do (but not by a substantial amount): "A new study... shows that [SAT prep] classes are effective in boosting scores-somewhat. 'Private classes increased scores an average of 60 points, while less specialized high school courses added 30 points, ' said Claudia Buchmann, coauthor of the study and associate professor of sociology at Ohio State University. " (Source: Seema Mehta, "Students Believe in the SAT," Los Angeles Times, March 1, 2008) A researcher would like to compare the effects on students' SAT scores from the following three types of preparation: taking a private SAT prep class offered by ScoreExcel, a company offering exam reviews; taking a less specialized prep class offered by a local high school; and not taking any prep class. Consider two statistical studies called Study A and Study B. In Study A, samples of students who had taken the SAT were randomly selected from populations defined by three different types of preparation: those taking the prep class offered by ScoreExcel; those taking the prep class offered by the local high school; and those not taking any prep class. Each sample consisted of 40 high school seniors, and their SAT scores were recorded. In Study B, 120 high school seniors who had not taken the SAT were randomly divided into three groups of 40 students each. Students in the first group were assigned to take the prep dass offered by ScoreExcel, those in the second group were assigned to take the prep class offered by the local high school, and those in the third group were not assigned to any prep class. At the end of the study, all the students took the SAT, and their scores were recorded. In both studies, the response variable is the students' SAT scores , and the independent variable is the type of preparation . Study A is an observational study, and Study B is an experimental study. Analysis of variance (ANOVA) is a statistical procedure to determine whether there are differences among the means of the populations defined by the treatments. In ANOVA, the null hypothesis is: 3 Ho: At least two of the population means are not equal Ho: All the population means are equal Ho: All the population means are different O Ho: At least two of the population means are equal The alternative hypothesis is: Ha: All the population means are equal O Ha: At least two of the population means are not equal Ha: All the population means are different O Ha: At least two of the population means are equalTo perform ANOVA, you assume the following: for each population, the response variable has a normal distribution; the variance of the response variable is the same for all populations ; and the observations are independent of each other . The assumption of independence may be satisfied in an experimental study with randomized design or in an observational study with random sampling. Assume that the data collected for both Study A and Study B are Identical. The following table summarizes the results. Use the information from the table to answer the remaining questions. Treatment, j Number of Observations, ni Sample Mean, X; Sample Variance, s;2 Private Prep Class 40 680 500 High School Prep Class 40 650 520 No Prep Class 40 635 540 When the study has a balanced design, the between-treatments estimate of o' is given by Therefore, it is an estimate of of based on the variability of the . For the data above, the between-treatments estimate of of is When the study has a balanced design, the within-treatments estimate of o' is given by . Therefore, it is an estimate of of based on the variability of the . For the data above, the within-treatments estimate of of is In ANOVA, the F test statistic is the ratio of the between-treatments estimate and the within-treatments estimate of the population variance o2. The value of the F test statistic for both studies is When the null hypothesis is true, both the between-treatments and within-treatments estimates of o2 the population variance. When the null hypothesis is false, the between-treatments estimate of 02 , while the within-treatments estimate of oz When the null hypothesis is true, the F test statistic is . When the null hypothesis is false, the F test statistic is most likely . Hence, you should reject the null hypothesis for In Study A, rejection of the null hypothesis_ a cause-and-effect relationship between type of preparation and SAT scores. In Study B, rejection of the null hypothesis a cause-and-effect relationship between type of preparation and SAT scores