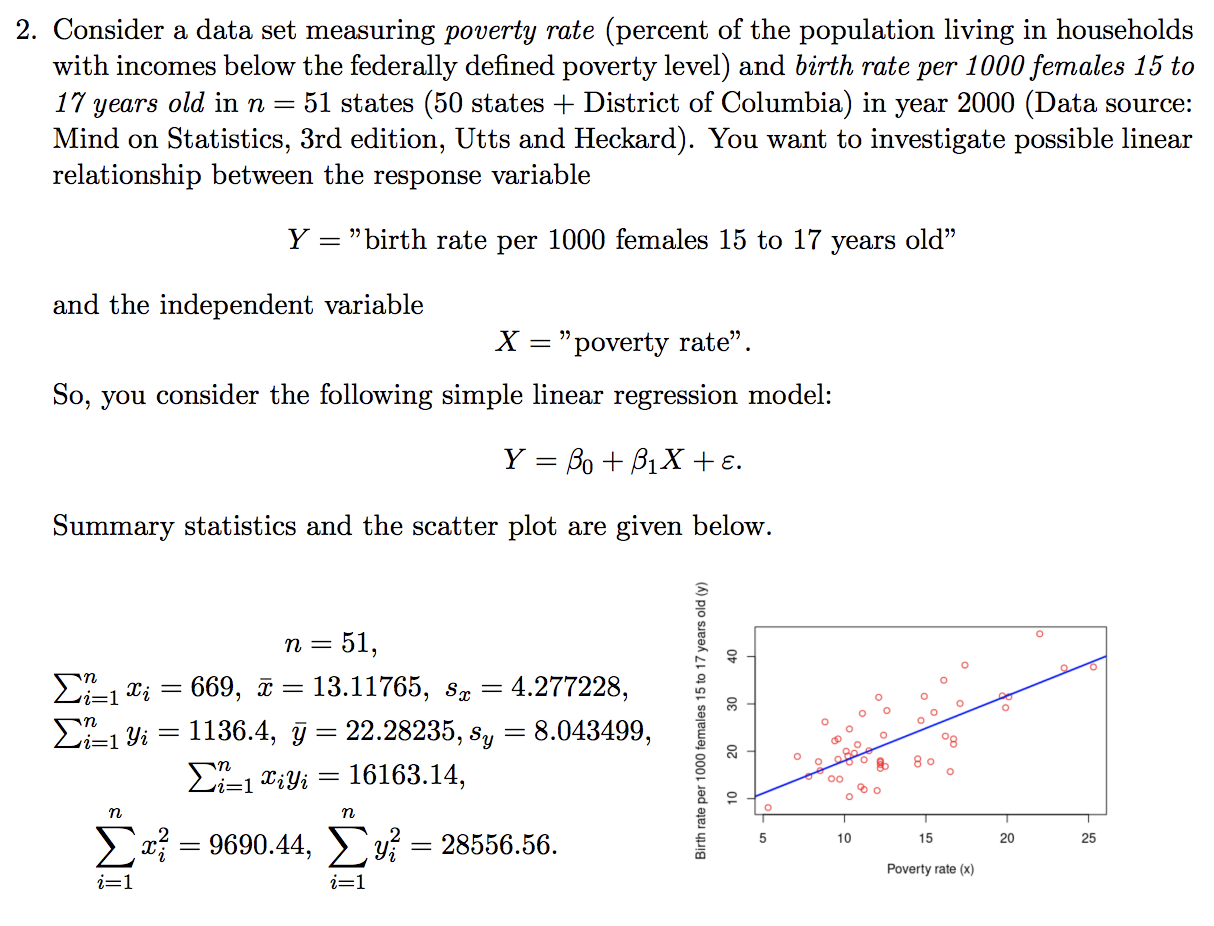
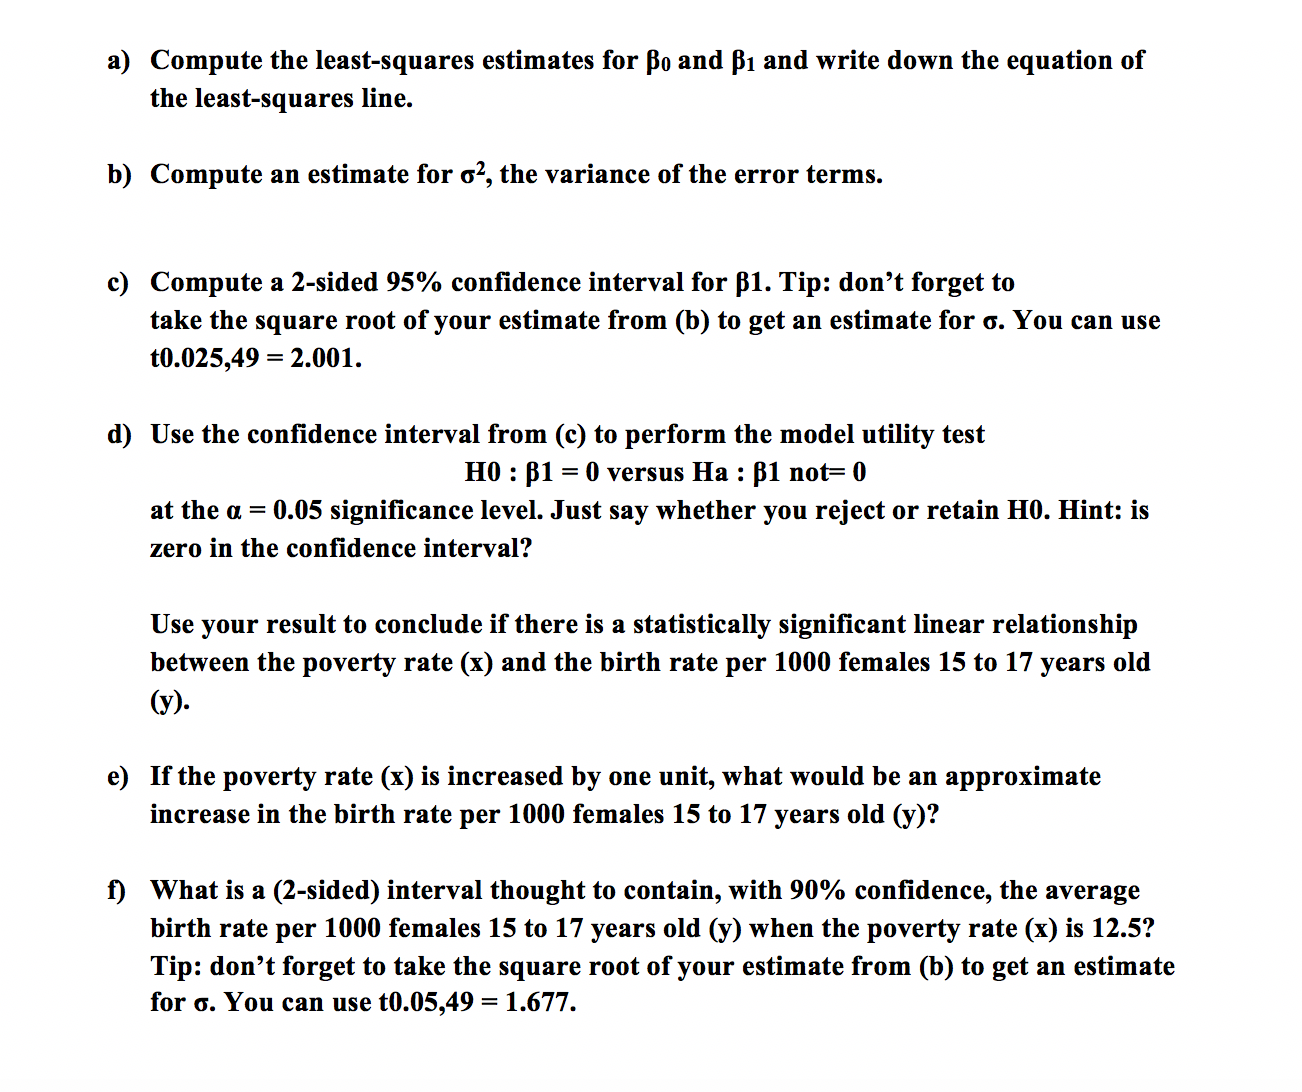
2. Consider a data set measuring poverty mic (percent of the population living in households with incomes below the federally dened poverty level) and birth mte per 1000 females 15 to 1'7 years old in n = 51 states (50 states + District of Columbia) in year 2000 (Data source: Mind on Statistics, 3rd edition, Utts and Heckard). You want to investigate possible linear relationship between the response variable Y = \"birth rate per 1000 females 15 to 17 years old\" and the independent variable X = \"poverty rate\". So, you consider the following simple linear regression model: Y = ,30 + 61X + 8. Summary statistics and the scatter plot are given below. it = 51, 3:1 3,- = 669, 5: = 13.11765, 3,, = 4.277228, 23:, y, = 1136.4, 37 = 22.28235, 3,, = 8.043499, 2?:1 33,3},- = 16163.14, 40 20 10 n n 2 m? = 9690.44, 2: yf = 28556.56. i=1 5 10 IS 2|] 25 Binh rate per 1000 females 15m 1? years old (y) 1'. Poveny me (x) i=1 a) b) '1) Compute the least-squares estimates for u and [h and write down the equation of the leastsquares line. Compute an estimate for 02, the variance of the error terms. Compute a 2-sided 95% confidence interval for BI. Tip: don't forget to take the square root of your estimate from (b) to get an estimate for a. You can use t0.025,49 = 2.001. Use the confidence interval from (c) to perform the model utility test H0 : [51 = 0 versus Ha: l not= 0 at the u = 0.05 significance level. Just say whether you reject or retain H0. Hint: is zero in the confidence interval? Use your result to conclude if there is a statistically signicant linear relationship between the poverty rate (x) and the birth rate per 1000 females 15 to 17 years old (if)- If the poverty rate (x) is increased by one unit, what would be an approximate increase in the birth rate per 1000 females 15 to 17 years old (y)? What is a (2-sided) interval thought to contain, with 90% confidence, the average birth rate per 1000 females 15 to 17 years old (y) when the poverty rate (1:) is 12.5? Tip: don't forget to take the square root of your estimate from (b) to get an estimate for a. You can use t0.05,49 = 1.677


