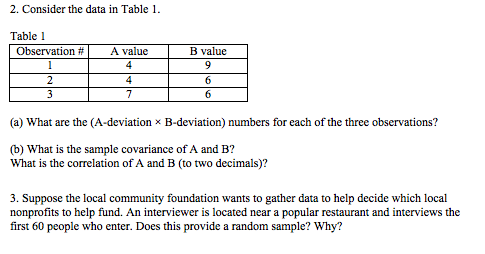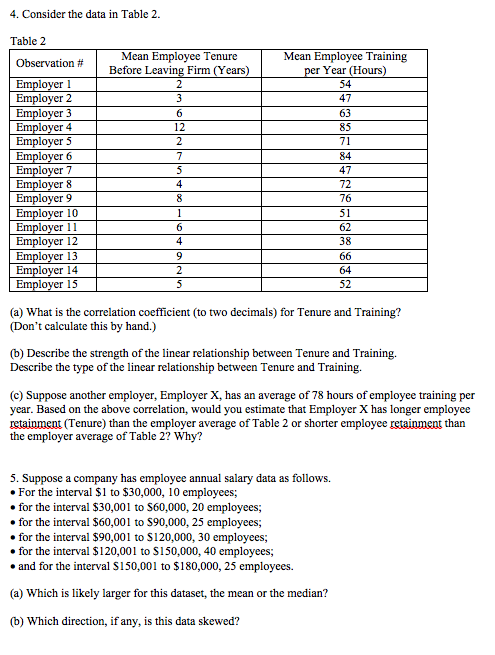

2. Consider the data in Table 1. Table 1 Observation # A value B value 149 246 (a) What are the (A-deviation * B-deviation) numbers for each of the three observations? (b) What is the sample covariance of A and B? What is the correlation of A and B (to two decimals)? 3. Suppose the local community foundation wants to gather data to help decide which local nonprofits to help fund. An interviewer is located near a popular restaurant and interviews the first 60 people who enter. Does this provide a random sample? Why? 4. Consider the data in Table 2. Table 2 Mean Employee Tenure Observation # Before Leaving Firm (Years) Employer Employer 2 Employer 3 T 6 Employer 4 12 Employer 5 2 Employer 6 7 Employer 7 5 Employer 8 4 Employer 9 8 Emplover 10 Employer 11 Emplover 12 4 Employer 139 1 Employer 14 2 Employer 15 5 Mean Employee Training per Year (Hours) S4 47 63 8 5 71 84 47 72 64 2 5 (a) What is the correlation coefficient (to two decimals) for Tenure and Training? (Don't calculate this by hand.) (b) Describe the strength of the linear relationship between Tenure and Training. Describe the type of the linear relationship between Tenure and Training (c) Suppose another employer, Employer X, has an average of 78 hours of employee training per year. Based on the above correlation, would you estimate that Employer X has longer employee retainment (Tenure) than the employer average of Table 2 or shorter employee retainment than the employer average of Table 2? Why? 5. Suppose a company has employee annual salary data as follows. . For the interval $1 to $30,000, 10 employees; for the interval $30,001 to $60,000, 20 employees; for the interval $60,001 to $90,000, 25 employees, for the interval $90,001 to S120,000, 30 employees, . for the interval $120,001 to $150,000, 40 employees, and for the interval S150,001 to $180,000, 25 employees. (a) Which is likely larger for this dataset, the mean or the median? (b) Which direction, if any, is this data skewed? 2. Consider the data in Table 1. Table 1 Observation # A value B value 149 246 (a) What are the (A-deviation * B-deviation) numbers for each of the three observations? (b) What is the sample covariance of A and B? What is the correlation of A and B (to two decimals)? 3. Suppose the local community foundation wants to gather data to help decide which local nonprofits to help fund. An interviewer is located near a popular restaurant and interviews the first 60 people who enter. Does this provide a random sample? Why? 4. Consider the data in Table 2. Table 2 Mean Employee Tenure Observation # Before Leaving Firm (Years) Employer Employer 2 Employer 3 T 6 Employer 4 12 Employer 5 2 Employer 6 7 Employer 7 5 Employer 8 4 Employer 9 8 Emplover 10 Employer 11 Emplover 12 4 Employer 139 1 Employer 14 2 Employer 15 5 Mean Employee Training per Year (Hours) S4 47 63 8 5 71 84 47 72 64 2 5 (a) What is the correlation coefficient (to two decimals) for Tenure and Training? (Don't calculate this by hand.) (b) Describe the strength of the linear relationship between Tenure and Training. Describe the type of the linear relationship between Tenure and Training (c) Suppose another employer, Employer X, has an average of 78 hours of employee training per year. Based on the above correlation, would you estimate that Employer X has longer employee retainment (Tenure) than the employer average of Table 2 or shorter employee retainment than the employer average of Table 2? Why? 5. Suppose a company has employee annual salary data as follows. . For the interval $1 to $30,000, 10 employees; for the interval $30,001 to $60,000, 20 employees; for the interval $60,001 to $90,000, 25 employees, for the interval $90,001 to S120,000, 30 employees, . for the interval $120,001 to $150,000, 40 employees, and for the interval S150,001 to $180,000, 25 employees. (a) Which is likely larger for this dataset, the mean or the median? (b) Which direction, if any, is this data skewed


