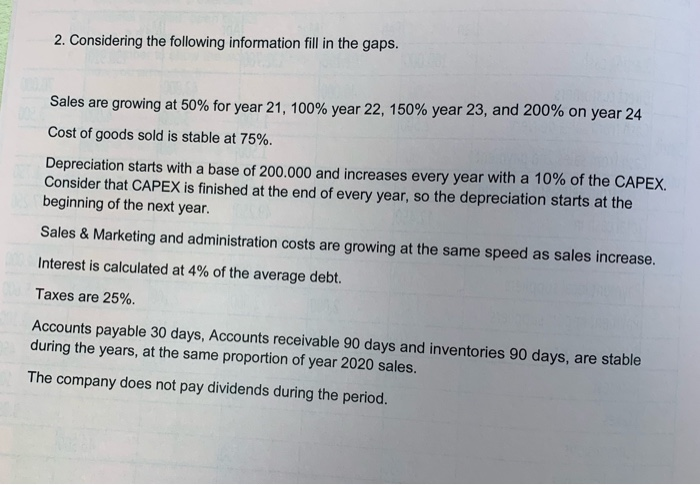
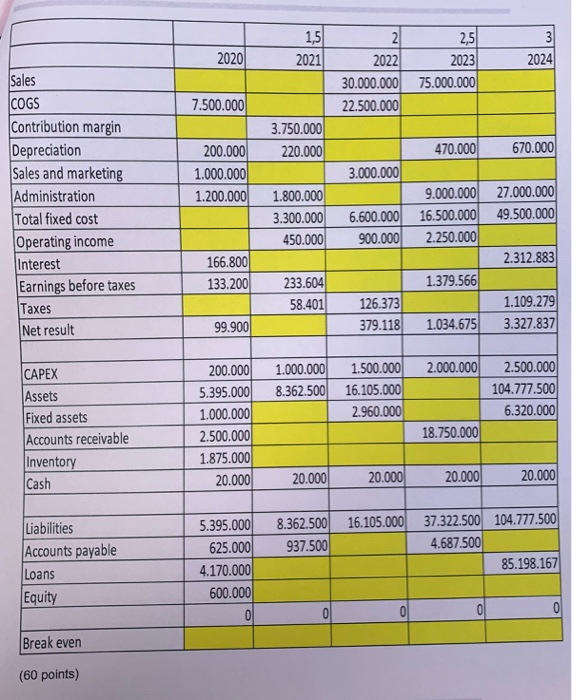
2. Considering the following information fill in the gaps. Sales are growing at 50% for year 21, 100% year 22, 150% year 23, and 200% on year 24 Cost of goods sold is stable at 75%. Depreciation starts with a base of 200.000 and increases every year with a 10% of the CAPEX. Consider that CAPEX is finished at the end of every year, so the depreciation starts at the beginning of the next year. Sales & Marketing and administration costs are growing at the same speed as sales increase. Interest is calculated at 4% of the average debt. Taxes are 25% Accounts payable 30 days, Accounts receivable 90 days and inventories 90 days, are stable during the years, at the same proportion of year 2020 sales. The company does not pay dividends during the period. 2020 2021 2 2022 30.000.000 22.500.000 2,5 2023 75.000.000 2024 7.500.000 3.750.000 220.000 470.000 670.000 Sales COGS Contribution margin Depreciation Sales and marketing Administration Total fixed cost Operating income Interest Earnings before taxes Taxes Net result 200.000 1.000.000 1.200.000 3.000.000 1.800.000 3.300.000 450.000 9.000.000 16.500.000 2.250.000 27.000.000 49.500.000 6.600.000 900.000 2.312.883 166.800 133.200 1.379.566 233.604 58.401 126.373 379.118 1.109.279 3.327.837 99.900 1.034.675 2.000.000 1.000.000 8.362.500 1.500.000 16.105.000 2.960.000 2.500.000 104.777.500 6.320.000 CAPEX Assets Fixed assets Accounts receivable Inventory Cash 200.000 5.395.000 1.000.000 2.500.000 1.875.000 20.000 18.750.000 20.000 20.000 20.000 20.000 16.105.000 104.777.500 8.362,500 937.500 37.322.500 4.687.500 Liabilities Accounts payable Loans Equity 5.395.000 625.000 4.170.000 600.000 0 85.198.167 0 OD Break even (60 points)