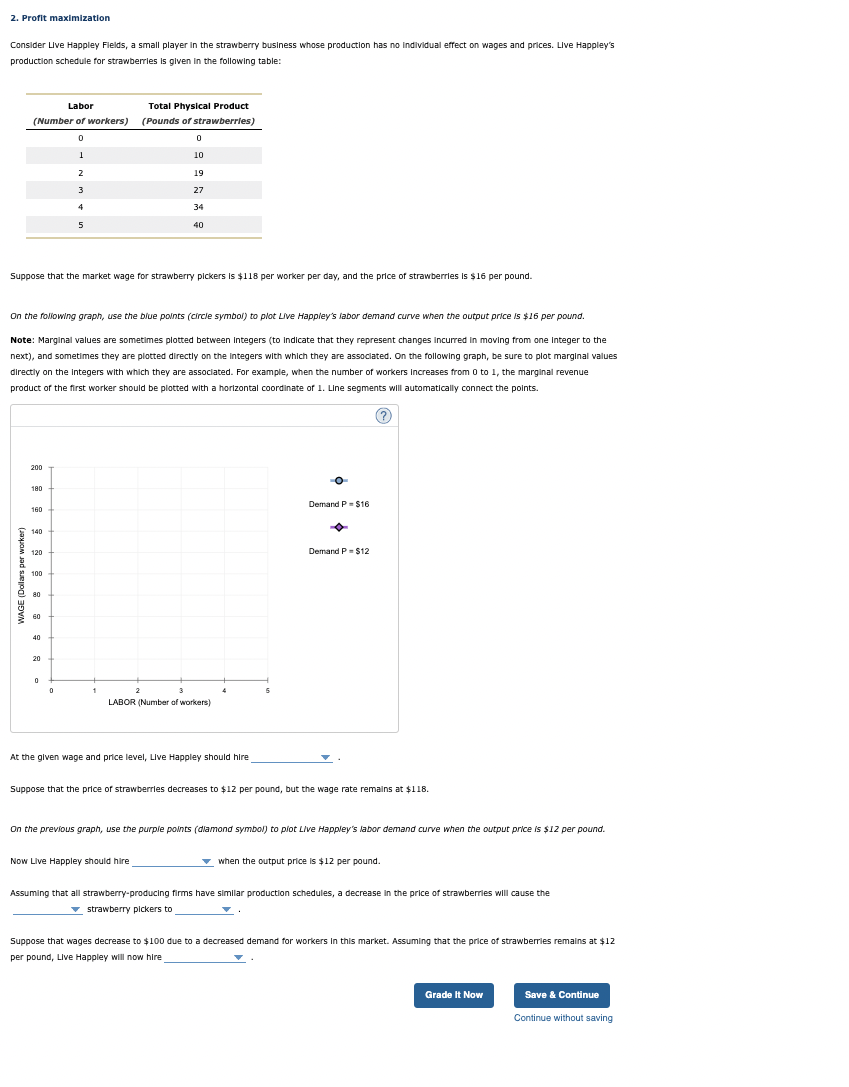
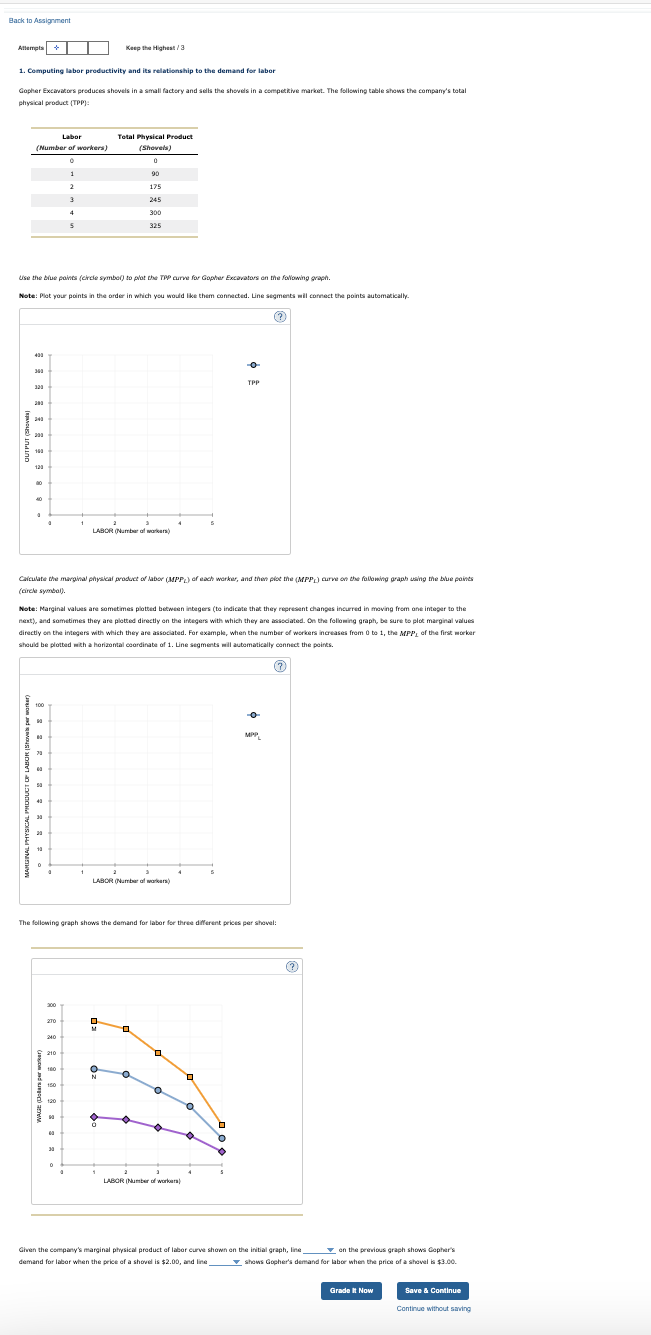
2. Profit maximization Consider Lve Happley Flelds, a small player in the strawberry business whose production has no individual effect on wages and prices. Live Happley's production schedule for strawberries is given in the following table: Suppose that the market wage for strawberry plckers is $118 per worker per day, and the price of strawberries is $16 per pound. On the following graph, use the blue points (Circle symbol) to plot Live Happley's fabor demand curve when the output price is $16 per pound. Note: Marginal values are sometimes plotted between integers (to indicate that they represent changes incurred in moving from one Integer to the next), and sometimes they are plotted directly on the integers with which they are assoclated. On the following graph, be sure to plot marginal values directly on the integers with which they are assoclated. For example, when the number of workers increases from 0 to 1 , the marginal revenue product of the first worker should be plotted with a horlzontal coordinate of 1 . Line segments will automatically connect the points. At the given wage and price level, Live Happley should hire Suppose that the price of strawberrles decreases to $12 per pound, but the wage rate remalns at $118. On the previous graph, use the purple points (dlamond symbol) to piot Llve Happley's labor demand curve when the output price is $12 per pound. Now Llve Happley should hilre when the output price is $12 per pound. Assuming that all strawberry-producing firms have simllar production schedules, a decrease in the price of strawberrles will cause the strawberry plckers to Suppose that wages decrease to $100 due to a decreased demand for workers In this market. Assuming that the price of strawberries remains at $12 per pound, Live Happley will now hire 1. Computing labor productivity and its relationship to the demand for labor Gupher Exeavacors productes shovels in a small factory and seds the shouds in a competikie market. The foliswing table shaws the compam's total physical product [TPP] Uise the biue pains (circie symbeg to plot the Top arre for Gopher Excavatars an the followng graph. Note: Plot your points in the order in which you would like them connected. Line segments wil connect the points autematically(airele symbal). Note: Marginal values are sometimes plotted between integers (to indicate that they represent changes incured in maving frem ane imteger to the sheuld be plotted wich a harizomtal courdinate of 1 . Line segments mil autematically cennect the peints. The follswing graph shows the demand for labor for three diferent priets per shavel: Given the cempany's marginal physical preduct of lakof curve shwn en the iritial graph, line _ demand for lakef when the price of a shoved is $2.00, and line shows Gophers demand for labor when the prioe of a shavel ba $3.00. 2. Profit maximization Consider Lve Happley Flelds, a small player in the strawberry business whose production has no individual effect on wages and prices. Live Happley's production schedule for strawberries is given in the following table: Suppose that the market wage for strawberry plckers is $118 per worker per day, and the price of strawberries is $16 per pound. On the following graph, use the blue points (Circle symbol) to plot Live Happley's fabor demand curve when the output price is $16 per pound. Note: Marginal values are sometimes plotted between integers (to indicate that they represent changes incurred in moving from one Integer to the next), and sometimes they are plotted directly on the integers with which they are assoclated. On the following graph, be sure to plot marginal values directly on the integers with which they are assoclated. For example, when the number of workers increases from 0 to 1 , the marginal revenue product of the first worker should be plotted with a horlzontal coordinate of 1 . Line segments will automatically connect the points. At the given wage and price level, Live Happley should hire Suppose that the price of strawberrles decreases to $12 per pound, but the wage rate remalns at $118. On the previous graph, use the purple points (dlamond symbol) to piot Llve Happley's labor demand curve when the output price is $12 per pound. Now Llve Happley should hilre when the output price is $12 per pound. Assuming that all strawberry-producing firms have simllar production schedules, a decrease in the price of strawberrles will cause the strawberry plckers to Suppose that wages decrease to $100 due to a decreased demand for workers In this market. Assuming that the price of strawberries remains at $12 per pound, Live Happley will now hire 1. Computing labor productivity and its relationship to the demand for labor Gupher Exeavacors productes shovels in a small factory and seds the shouds in a competikie market. The foliswing table shaws the compam's total physical product [TPP] Uise the biue pains (circie symbeg to plot the Top arre for Gopher Excavatars an the followng graph. Note: Plot your points in the order in which you would like them connected. Line segments wil connect the points autematically(airele symbal). Note: Marginal values are sometimes plotted between integers (to indicate that they represent changes incured in maving frem ane imteger to the sheuld be plotted wich a harizomtal courdinate of 1 . Line segments mil autematically cennect the peints. The follswing graph shows the demand for labor for three diferent priets per shavel: Given the cempany's marginal physical preduct of lakof curve shwn en the iritial graph, line _ demand for lakef when the price of a shoved is $2.00, and line shows Gophers demand for labor when the prioe of a shavel ba $3.00