

Answered step by step
Verified Expert Solution
Question
1 Approved Answer
2. RTD temperature sensor was used to measure oil temperature in a research project. The sensor output was connected into a signal conditioning unit. The
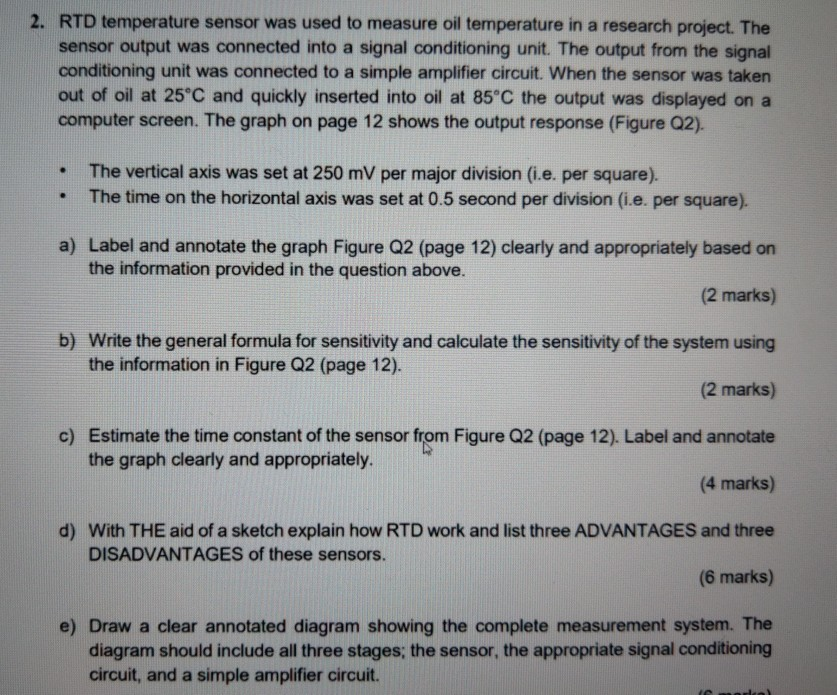
2. RTD temperature sensor was used to measure oil temperature in a research project. The sensor output was connected into a signal conditioning unit. The output from the signal conditioning unit was connected to a simple amplifier circuit. When the sensor was taken out of oil at 25C and quickly inserted into oil at 85C the output was displayed on a computer screen. The graph on page 12 shows the output response (Figure Q2). The vertical axis was set at 250 mV per major division (i.e. per square). The time on the horizontal axis was set at 0.5 second per division (i.e. per square). a) Label and annotate the graph Figure Q2 (page 12) clearly and appropriately based on the information provided in the question above. (2 marks) b) Write the general formula for sensitivity and calculate the sensitivity of the system using the information in Figure Q2 (page 12). (2 marks) c) Estimate the time constant of the sensor from Figure Q2 (page 12). Label and annotate the graph clearly and appropriately. (4 marks) d) With THE aid of a sketch explain how RTD work and list three ADVANTAGES and three DISADVANTAGES of these sensors. (6 marks) e) Draw a clear annotated diagram showing the complete measurement system. The diagram should include all three stages; the sensor, the appropriate signal conditioning circuit, and a simple amplifier circuit. 2. RTD temperature sensor was used to measure oil temperature in a research project. The sensor output was connected into a signal conditioning unit. The output from the signal conditioning unit was connected to a simple amplifier circuit. When the sensor was taken out of oil at 25C and quickly inserted into oil at 85C the output was displayed on a computer screen. The graph on page 12 shows the output response (Figure Q2). The vertical axis was set at 250 mV per major division (i.e. per square). The time on the horizontal axis was set at 0.5 second per division (i.e. per square). a) Label and annotate the graph Figure Q2 (page 12) clearly and appropriately based on the information provided in the question above. (2 marks) b) Write the general formula for sensitivity and calculate the sensitivity of the system using the information in Figure Q2 (page 12). (2 marks) c) Estimate the time constant of the sensor from Figure Q2 (page 12). Label and annotate the graph clearly and appropriately. (4 marks) d) With THE aid of a sketch explain how RTD work and list three ADVANTAGES and three DISADVANTAGES of these sensors. (6 marks) e) Draw a clear annotated diagram showing the complete measurement system. The diagram should include all three stages; the sensor, the appropriate signal conditioning circuit, and a simple amplifier circuit
Step by Step Solution
There are 3 Steps involved in it
Step: 1

Get Instant Access to Expert-Tailored Solutions
See step-by-step solutions with expert insights and AI powered tools for academic success
Step: 2

Step: 3
Ace Your Homework with AI
Get the answers you need in no time with our AI-driven, step-by-step assistance
Get Started
Auditing Philosophy And Technique
Authors: John William Cook
1st Edition
039520660X, 978-0395206607