

Answered step by step
Verified Expert Solution
Question
1 Approved Answer
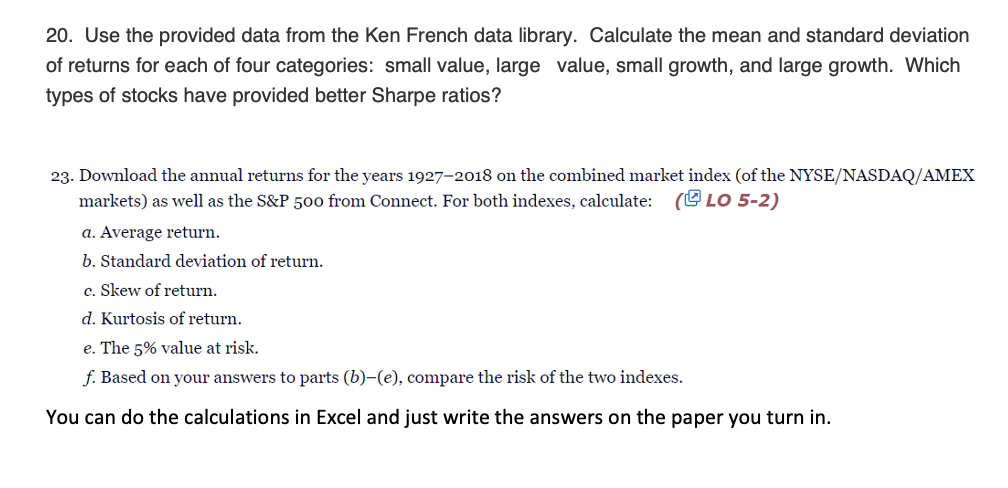
20. Use the provided data from the Ken French data library. Calculate the mean and standard deviation of returns for each of four categories: small
Step by Step Solution
There are 3 Steps involved in it
Step: 1

Get Instant Access to Expert-Tailored Solutions
See step-by-step solutions with expert insights and AI powered tools for academic success
Step: 2

Step: 3
Ace Your Homework with AI
Get the answers you need in no time with our AI-driven, step-by-step assistance
Get Started
Victorian Literature And Finance
Authors: Francis O'Gorman
1st Edition
0199281920, 978-0199281923