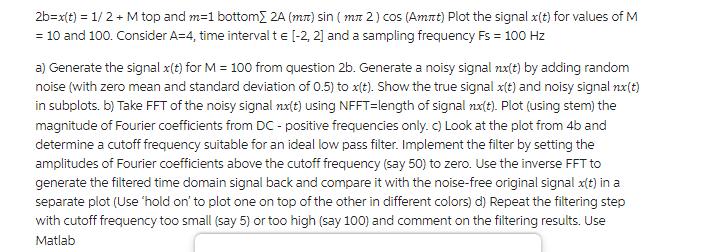
Question: 2b=x(t) = 1/2 + M top and m=1 bottom 2A (mn) sin ( mn 2) cos (Amrt) Plot the signal x(t) for values of

2b=x(t) = 1/2 + M top and m=1 bottom 2A (mn) sin ( mn 2) cos (Amrt) Plot the signal x(t) for values of M = 10 and 100. Consider A=4, time interval t = [-2, 2] and a sampling frequency Fs = 100 Hz a) Generate the signal x(t) for M = 100 from question 2b. Generate a noisy signal nx(t) by adding random noise (with zero mean and standard deviation of 0.5) to x(t). Show the true signal x(t) and noisy signal nx(t) in subplots. b) Take FFT of the noisy signal nx(t) using NFFT=length of signal nx(t). Plot (using stem) the magnitude of Fourier coefficients from DC-positive frequencies only. c) Look at the plot from 4b and determine a cutoff frequency suitable for an ideal low pass filter. Implement the filter by setting the amplitudes of Fourier coefficients above the cutoff frequency (say 50) to zero. Use the inverse FFT to generate the filtered time domain signal back and compare it with the noise-free original signal x(t) in a separate plot (Use 'hold on to plot one on top of the other in different colors) d) Repeat the filtering step with cutoff frequency too small (say 5) or too high (say 100) and comment on the filtering results. Use Matlab
Step by Step Solution
3.51 Rating (148 Votes )
There are 3 Steps involved in it
Certainly Heres an example implementation in MATLAB that addresses the problem requirements MATLAB Part a M 100 A 4 t linspace2 2 400 Fs 100 dt 1Fs xt ... View full answer

Get step-by-step solutions from verified subject matter experts


