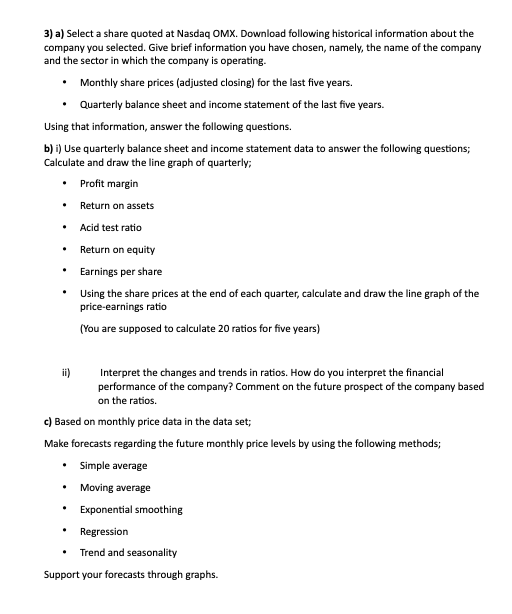
3) a) Select a share quoted at Nasdaq OMX. Download following historical information about the company you selected. Give brief information you have chosen, namely, the name of the company and the sector in which the company is operating. - Monthly share prices (adjusted closing) for the last five years. - Quarterly balance sheet and income statement of the last five years. Using that information, answer the following questions. b) i) Use quarterly balance sheet and income statement data to answer the following questions; Calculate and draw the line graph of quarterly; - Profit margin - Return on assets - Acid test ratio - Return on equity - Earnings per share - Using the share prices at the end of each quarter, calculate and draw the line graph of the price-earnings ratio (You are supposed to calculate 20 ratios for five years) ii) Interpret the changes and trends in ratios. How do you interpret the financial performance of the company? Comment on the future prospect of the company based on the ratios. c) Based on monthly price data in the data set; Make forecasts regarding the future monthly price levels by using the following methods; - Simple average - Moving average - Exponential smoothing - Regression - Trend and seasonality Support your forecasts through graphs. 3) a) Select a share quoted at Nasdaq OMX. Download following historical information about the company you selected. Give brief information you have chosen, namely, the name of the company and the sector in which the company is operating. - Monthly share prices (adjusted closing) for the last five years. - Quarterly balance sheet and income statement of the last five years. Using that information, answer the following questions. b) i) Use quarterly balance sheet and income statement data to answer the following questions; Calculate and draw the line graph of quarterly; - Profit margin - Return on assets - Acid test ratio - Return on equity - Earnings per share - Using the share prices at the end of each quarter, calculate and draw the line graph of the price-earnings ratio (You are supposed to calculate 20 ratios for five years) ii) Interpret the changes and trends in ratios. How do you interpret the financial performance of the company? Comment on the future prospect of the company based on the ratios. c) Based on monthly price data in the data set; Make forecasts regarding the future monthly price levels by using the following methods; - Simple average - Moving average - Exponential smoothing - Regression - Trend and seasonality Support your forecasts through graphs


