Answered step by step
Verified Expert Solution
Question
1 Approved Answer
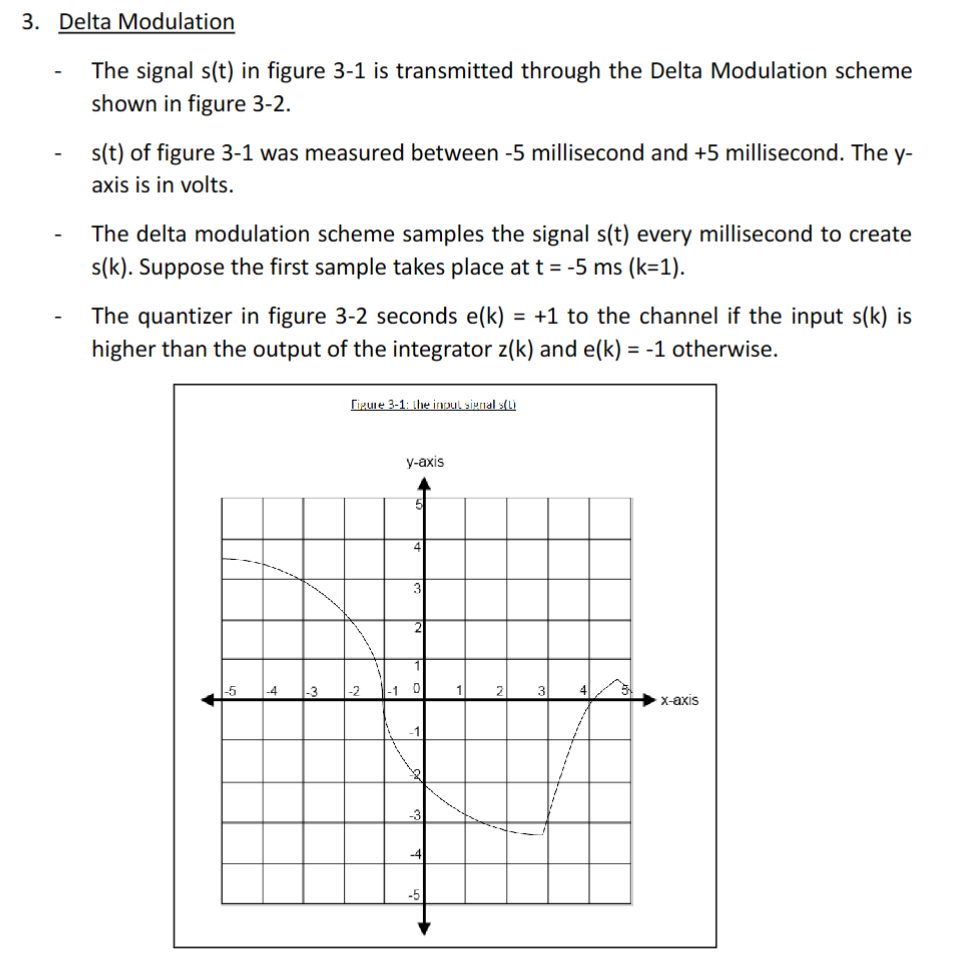
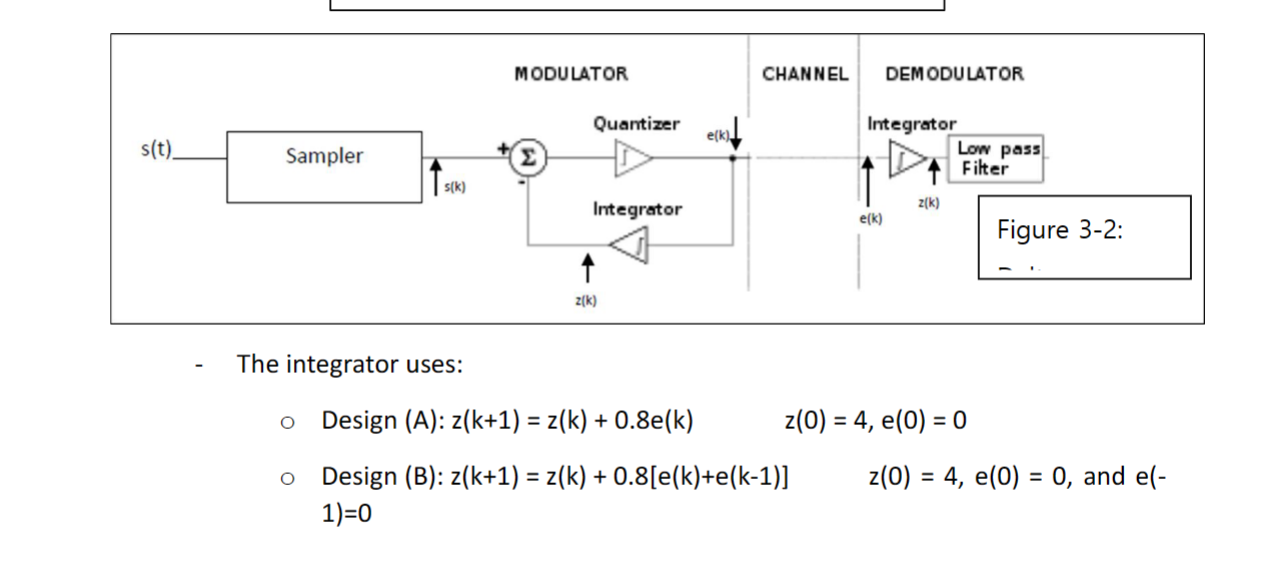
3. Delta Modulation The signal s(t) in figure 3-1 is transmitted through the Delta Modulation scheme shown in figure 3-2. s(t) of figure 3-1


3. Delta Modulation The signal s(t) in figure 3-1 is transmitted through the Delta Modulation scheme shown in figure 3-2. s(t) of figure 3-1 was measured between -5 millisecond and +5 millisecond. The y- axis is in volts. The delta modulation scheme samples the signal s(t) every millisecond to create s(k). Suppose the first sample takes place at t = -5 ms (k=1). The quantizer in figure 3-2 seconds e(k) = +1 to the channel if the input s(k) is higher than the output of the integrator z(k) and e(k) = -1 otherwise. Figure 3-1: the input signal s(L) y-axis -5 -4 3 -2 1 2 3 4 x-axis -3 -4 s(t). Sampler s(k) MODULATOR Quantizer e(k) Integrator z(k) The integrator uses: Design (A): z(k+1) = z(k) + 0.8e(k) CHANNEL DEMODULATOR Integrator Low pass Filter z(k) e(k) Figure 3-2: Design (B): z(k+1) = z(k) + 0.8[e(k)+e(k-1)] 1)=0 z(0) = 4, e(0) = 0 z(0) 4, e(0) = 0, and e(- A. Find the estimate z(k) for design (A) and (B). B. Compare how the two schemes process the signal s(t); discuss advantages and disadvantages of using either scheme for this type of signal; how would you improve the system with respect to signals like s(t)? C. Suppose we doubled the sampling rate (sample every 0.5 milliseconds). Find the estimate z(k) for design (A) and (B). Compare the results to the estimate found in part (A).
Step by Step Solution
There are 3 Steps involved in it
Step: 1

Get Instant Access to Expert-Tailored Solutions
See step-by-step solutions with expert insights and AI powered tools for academic success
Step: 2

Step: 3

Ace Your Homework with AI
Get the answers you need in no time with our AI-driven, step-by-step assistance
Get Started


