

Question: (3) draw a graph that shows roughly the shape of the probability distributions for high tech, rubber and t-bills. INTEGRATIVE PROBLEM Assume you recently graduated
(3) draw a graph that shows roughly the shape of the probability distributions for high tech, rubber and t-bills.
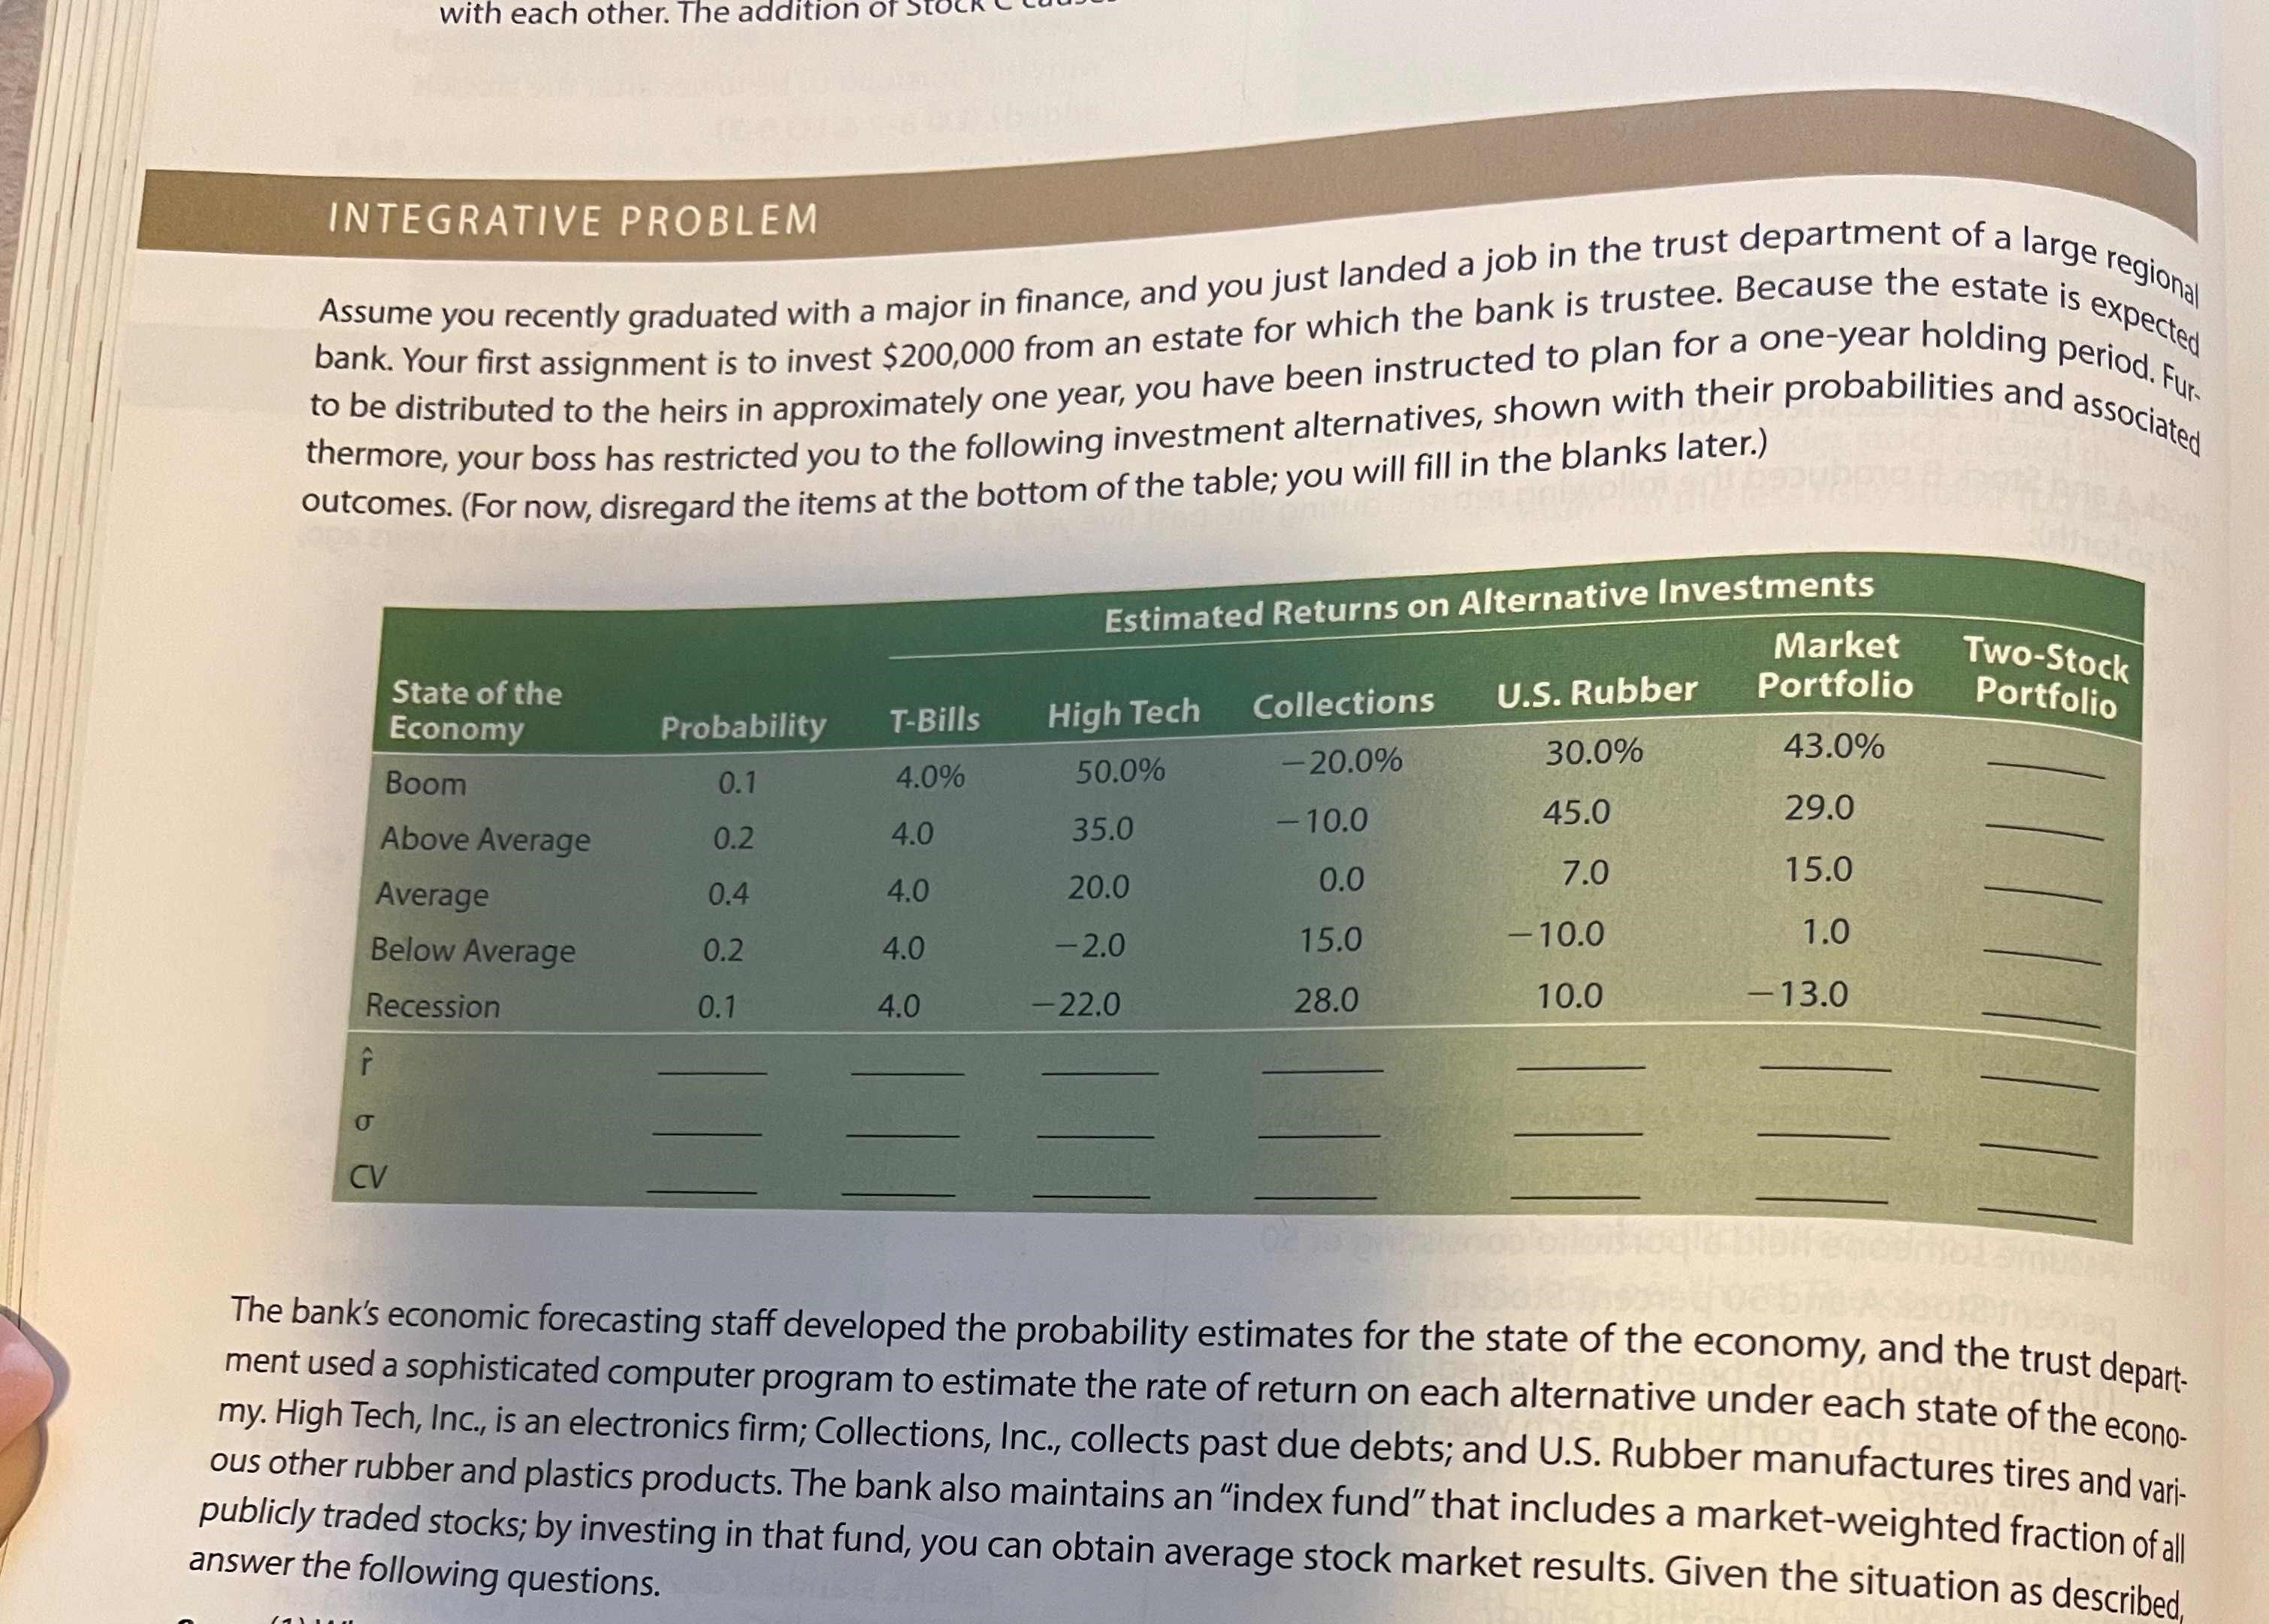
INTEGRATIVE PROBLEM Assume you recently graduated with a major in finance, and you just landed a job in the trust department of a large rana bank. Your first assignment is to invest $200,000 from an estate for which the bank is trustee. Because the estate is expected to be distributed to the heirs in approximately one year, you have been instructed to plan for a one-year holding period. Fur. thermore, your boss has restricted you to the following investment alternatives, shown with their probabilities and associated outcomes. (For now, disregard the items at the bottom of the table; you will fill in the blanks later.) The bank's economic forecasting staff developed the probability estimates for the state of the economy, and the trust department used a sophisticated computer program to estimate the rate of return on each alternative under each state of the economy. High Tech, Inc., is an electronics firm; Collections, Inc., collects past due debts; and U.S. Rubber manufactures tires and various other rubber and plastics products. The bank also maintains an "index fund" that includes a market-weighted fraction of all oublicly traded stocks; by investing in that fund, you can obtain average stock market results. Given the situation as described, nswer the following questions. c. You should recognize that basing a decision solely on expected returns is appropriate only for riskneutral individuals. Because the beneficiaries of the trust, like virtually everyone, are risk averse, the riskiness of each alternative is an important aspect of the decision. One possible measure of risk is the standard deviation of returns. (1) Calculate this value for each alternative, and fill in the row for in the table. (2) What type of risk does the standard deviation measure? (3) Draw a graph that shows
Step by Step Solution
There are 3 Steps involved in it

Get step-by-step solutions from verified subject matter experts