Question
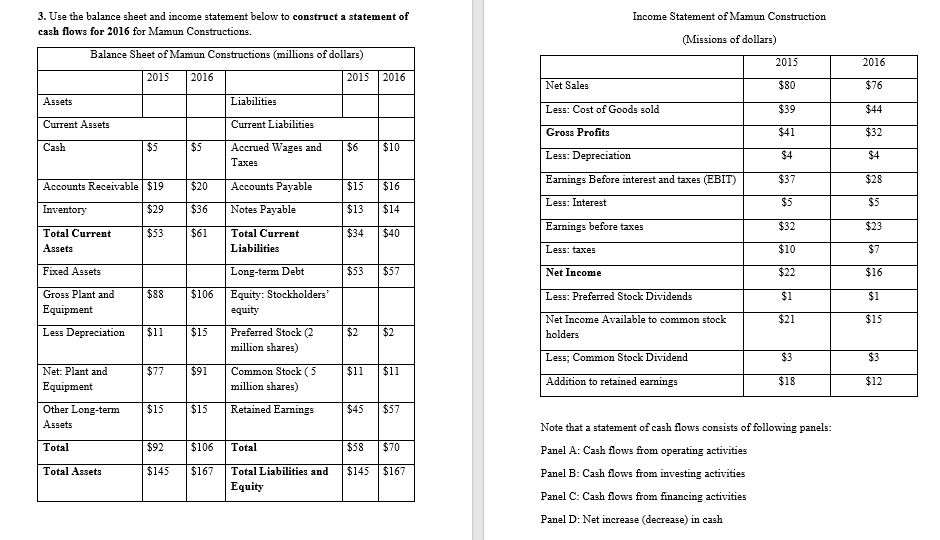
3. Use the balance sheet and income statement below to construct a statement of cash flows for 2016 for Mamun Constructions. Balance Sheet of Mamun
 3. Use the balance sheet and income statement below to construct a statement of cash flows for 2016 for Mamun Constructions. Balance Sheet of Mamun Constructions (millions of dollars) 2015 2016 2015 2016 Assets Liabilities Current Assets Current Liabilities Cash $5 $5 Accrued Wages and Taxes $6 $10 Accounts Receivable $19 $20 Accounts Payable $15 $16 Inventory $29 $36 Notes Payable $13 $14 Total Current Assets $53 $61 Total Current Liabilities $34 $40 Fixed Assets Long-term Debt $53 $57 Gross Plant and Equipment $88 $106 Equity: Stockholders equity Less Depreciation $11 $15 Preferred Stock (2 million shares) $2 $2 Net: Plant and Equipment $77 $91 Common Stock ( 5 million shares) $11 $11 Other Long-term Assets $15 $15 Retained Earnings $45 $57 Total $92 $106 Total $58 $70 Total Assets $145 $167 Total Liabilities and Equity $145 $167 Income Statement of Mamun Construction (Missions of dollars) 2015 2016 Net Sales $80 $76 Less: Cost of Goods sold $39 $44 Gross Profits $41 $32 Less: Depreciation $4 $4 Earnings Before interest and taxes (EBIT) $37 $28 Less: Interest $5 $5 Earnings before taxes $32 $23 Less: taxes $10 $7 Net Income $22 $16 Less: Preferred Stock Dividends $1 $1 Net Income Available to common stock holders $21 $15 Less; Common Stock Dividend $3 $3 Addition to retained earnings $18 $12 Note that a statement of cash flows consists of following panels: Panel A: Cash flows from operating activities Panel B: Cash flows from investing activities Panel C: Cash flows from financing activities Panel D: Net increase (decrease) in cash
Step by Step Solution
There are 3 Steps involved in it
Step: 1

Get Instant Access to Expert-Tailored Solutions
See step-by-step solutions with expert insights and AI powered tools for academic success
Step: 2

Step: 3

Ace Your Homework with AI
Get the answers you need in no time with our AI-driven, step-by-step assistance
Get Started


