Answered step by step
Verified Expert Solution
Question
1 Approved Answer
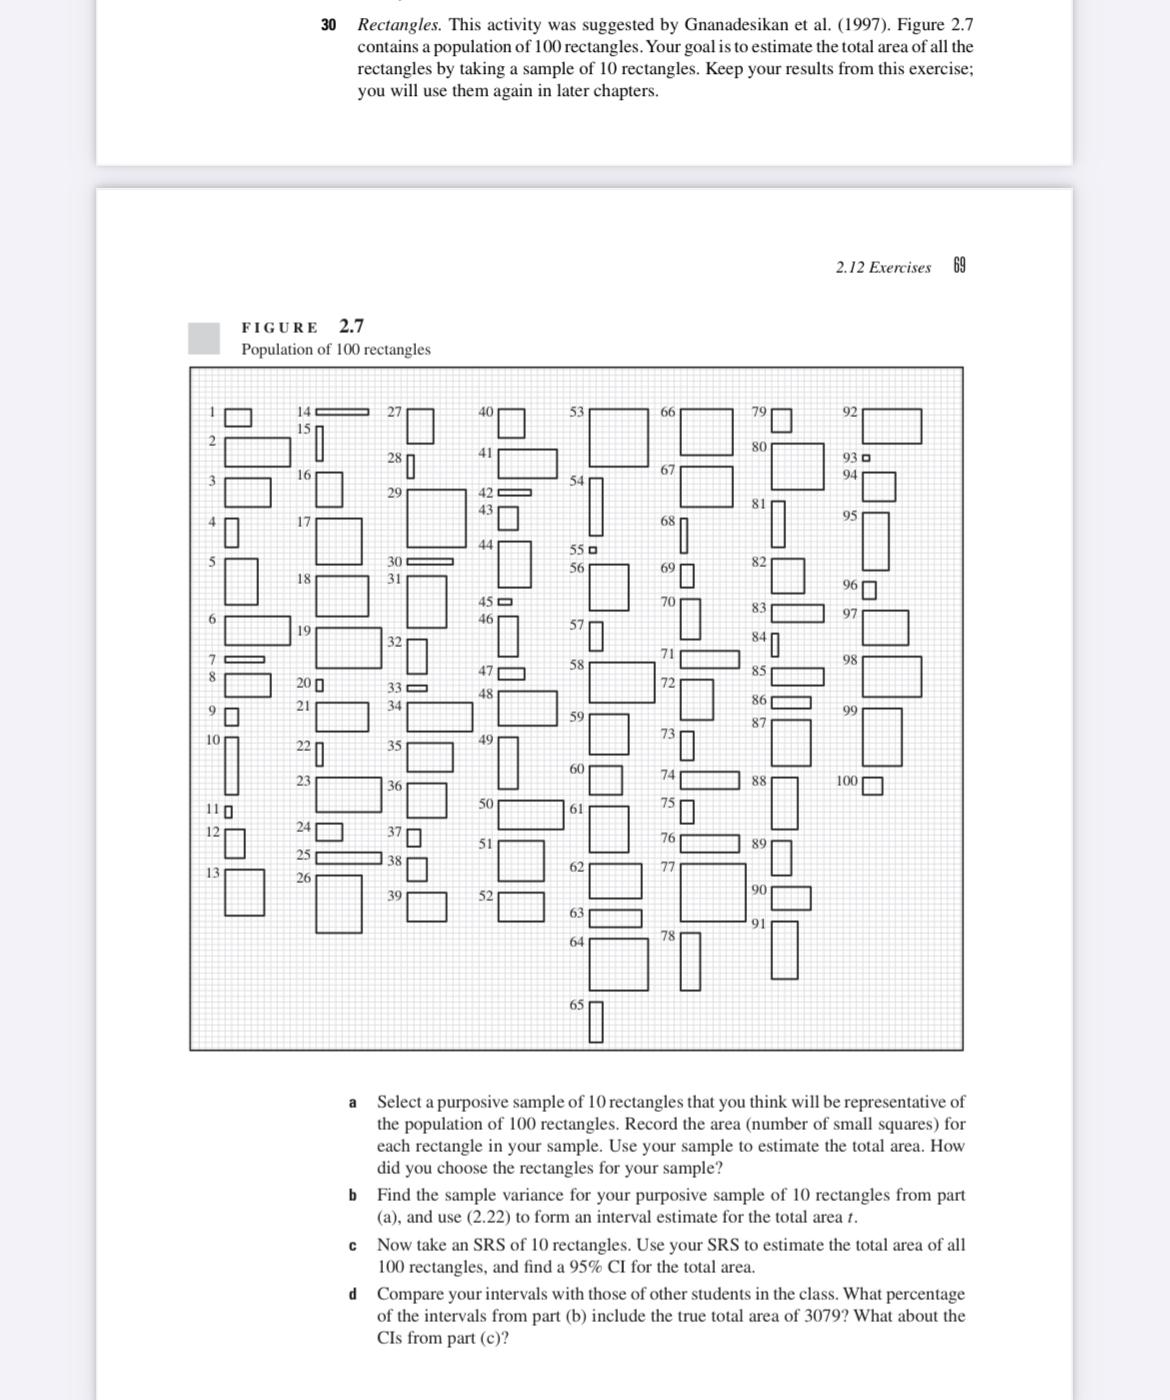
30 Rectangles. This activity was suggested by Gnanadesikan et al. (1997). Figure 2.7 contains a population of 100 rectangles. Your goal is to estimate

30 Rectangles. This activity was suggested by Gnanadesikan et al. (1997). Figure 2.7 contains a population of 100 rectangles. Your goal is to estimate the total area of all the rectangles by taking a sample of 10 rectangles. Keep your results from this exercise; you will use them again in later chapters. FIGURE 2.7 Population of 100 rectangles 19 27 40 66 79 80 41 280 29 42 43 67 30 45- 46 55 56 82 2.12 Exercises 69 jdo'j 98 47 200 33- 48 21 34 99 73 10. 49 220 35 74 23 100 36 =2 50 110 61 24 76 51 25 62 77 13 26 90 52 91 64 a Select a purposive sample of 10 rectangles that you think will be representative of the population of 100 rectangles. Record the area (number of small squares) for each rectangle in your sample. Use your sample to estimate the total area. How did you choose the rectangles for your sample? b Find the sample variance for your purposive sample of 10 rectangles from part (a), and use (2.22) to form an interval estimate for the total area t. C Now take an SRS of 10 rectangles. Use your SRS to estimate the total area of all 100 rectangles, and find a 95% CI for the total area. d Compare your intervals with those of other students in the class. What percentage of the intervals from part (b) include the true total area of 3079? What about the Cls from part (c)?
Step by Step Solution
There are 3 Steps involved in it
Step: 1

Get Instant Access to Expert-Tailored Solutions
See step-by-step solutions with expert insights and AI powered tools for academic success
Step: 2

Step: 3

Ace Your Homework with AI
Get the answers you need in no time with our AI-driven, step-by-step assistance
Get Started


