Answered step by step
Verified Expert Solution
Question
1 Approved Answer
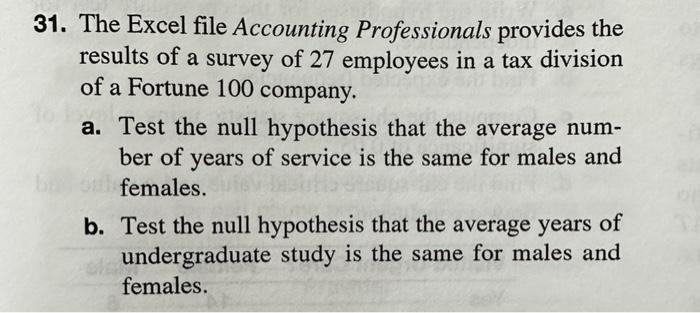
31. The Excel file Accounting Professionals provides the results of a survey of 27 employees in a tax division of a Fortune 100 company.


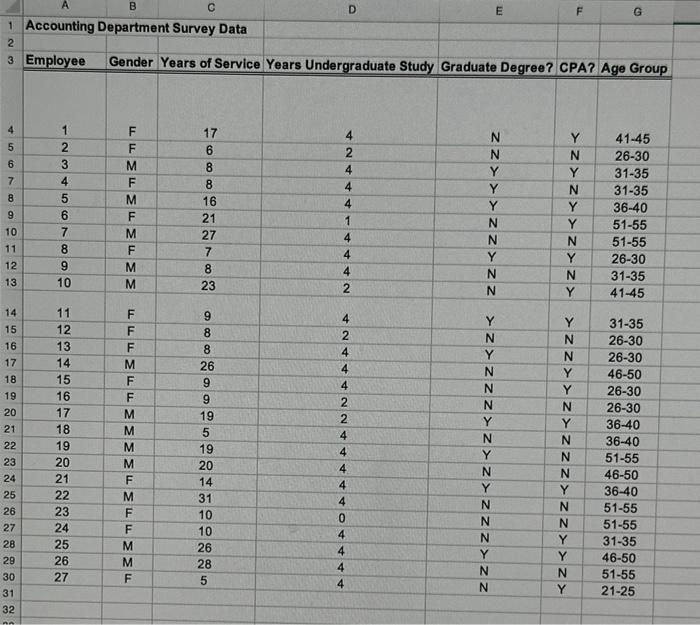
31. The Excel file Accounting Professionals provides the results of a survey of 27 employees in a tax division of a Fortune 100 company. a. Test the null hypothesis that the average num- ber of years of service is the same for males and females. b. Test the null hypothesis that the average years of undergraduate study is the same for males and females. B 1 Accounting Department Survey Data 2 3 Employee Gender Years of Service Years Undergraduate Study Graduate Degree? CPA? Age Group 456980 DIN 3 10 11 12 13 14 15 16 17 18 19 20 21 22 23 24 25 26 27 28 29 30 31 32 no 123456789 FFMFMFMFMM 10 11 12 13 14 15 16 17 18 19 20 21 222222 23 24 25 27 FFFMFLMMMMLMLMMF 17 7888S22782 16 21 23 S882861522 19 19 20 14 31 10 10 26 28 5 4 2 4 4 4 1 4 4 D 4 2 4 2 4 4 4 2 2 4 4 4 4 4 0 4 4 4 4 ZZYYYZZ>ZZ > >> E N N N N N N Y N Y N N N Y N Y N Y N N N N N Y Y N Y N Y Y N Y N Y Y N N Y Y Y N N N F Y N N Y Y N Y G 41-45 26-30 31-35 31-35 36-40 51-55 51-55 26-30 31-35 41-45 31-35 26-30 26-30 46-50 26-30 26-30 36-40 36-40 51-55 46-50 36-40 51-55 51-55 31-35 46-50 51-55 21-25
Step by Step Solution
There are 3 Steps involved in it
Step: 1
To test the null hypotheses regarding the average number of years of service and the average years o...
Get Instant Access to Expert-Tailored Solutions
See step-by-step solutions with expert insights and AI powered tools for academic success
Step: 2

Step: 3

Ace Your Homework with AI
Get the answers you need in no time with our AI-driven, step-by-step assistance
Get Started


