

Answered step by step
Verified Expert Solution
Question
1 Approved Answer
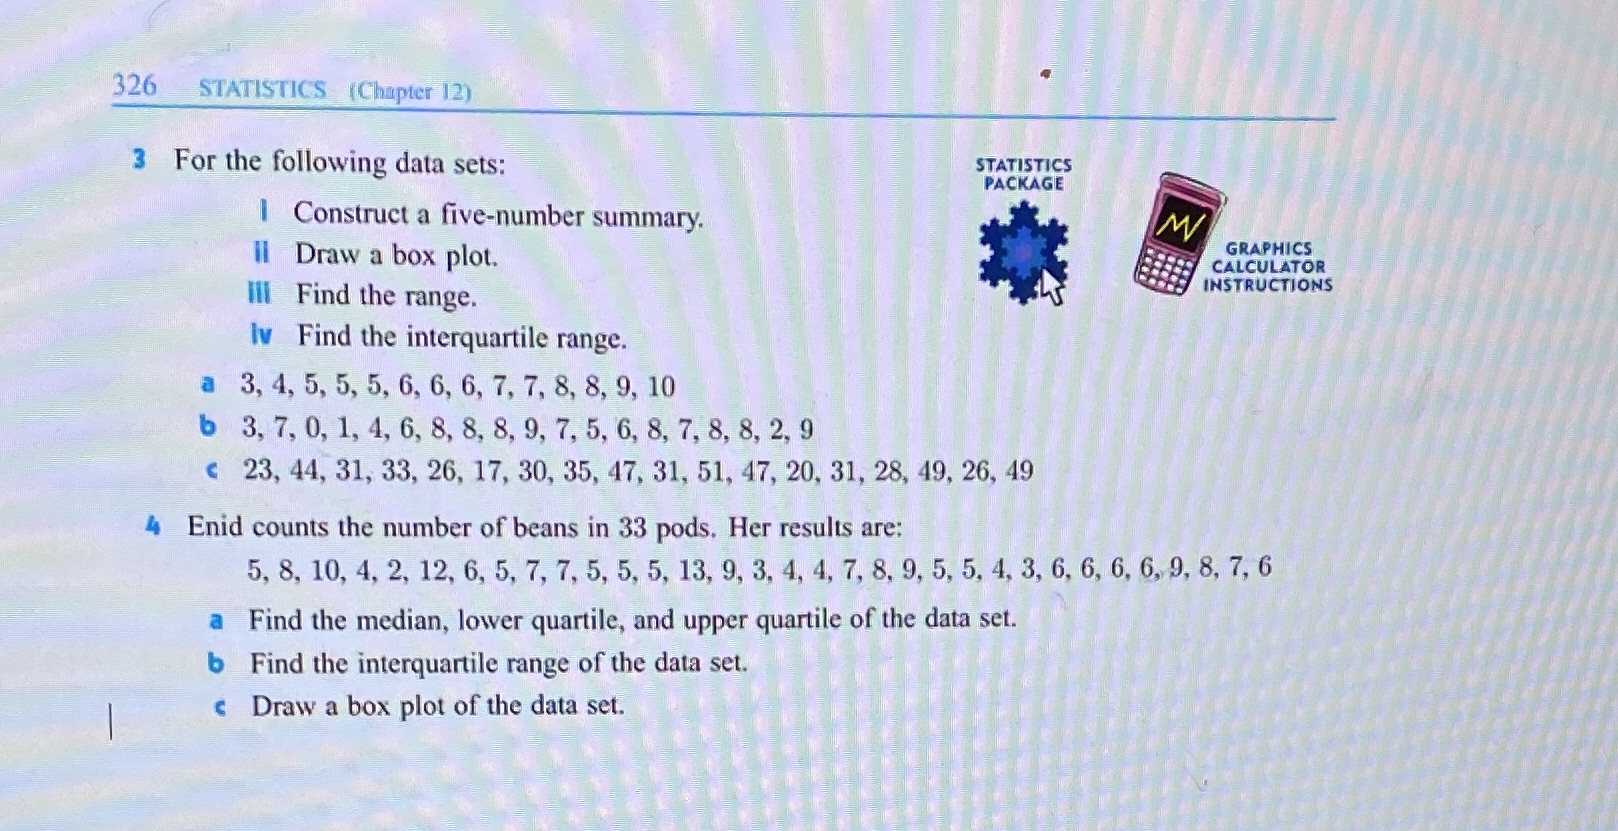
326 STATISTICS (Chapter 12) 3 For the following data sets: STATISTICS PACKAGE I Construct a five-number summary. Il Draw a box plot. GRAPHICS CALCULATOR ill
Step by Step Solution
There are 3 Steps involved in it
Step: 1

Get Instant Access to Expert-Tailored Solutions
See step-by-step solutions with expert insights and AI powered tools for academic success
Step: 2

Step: 3
Ace Your Homework with AI
Get the answers you need in no time with our AI-driven, step-by-step assistance
Get Started
Intermediate Algebra A Text/Workbook
Authors: Charles P McKeague
2nd Edition
1483214176, 9781483214177