Answered step by step
Verified Expert Solution
Question
1 Approved Answer
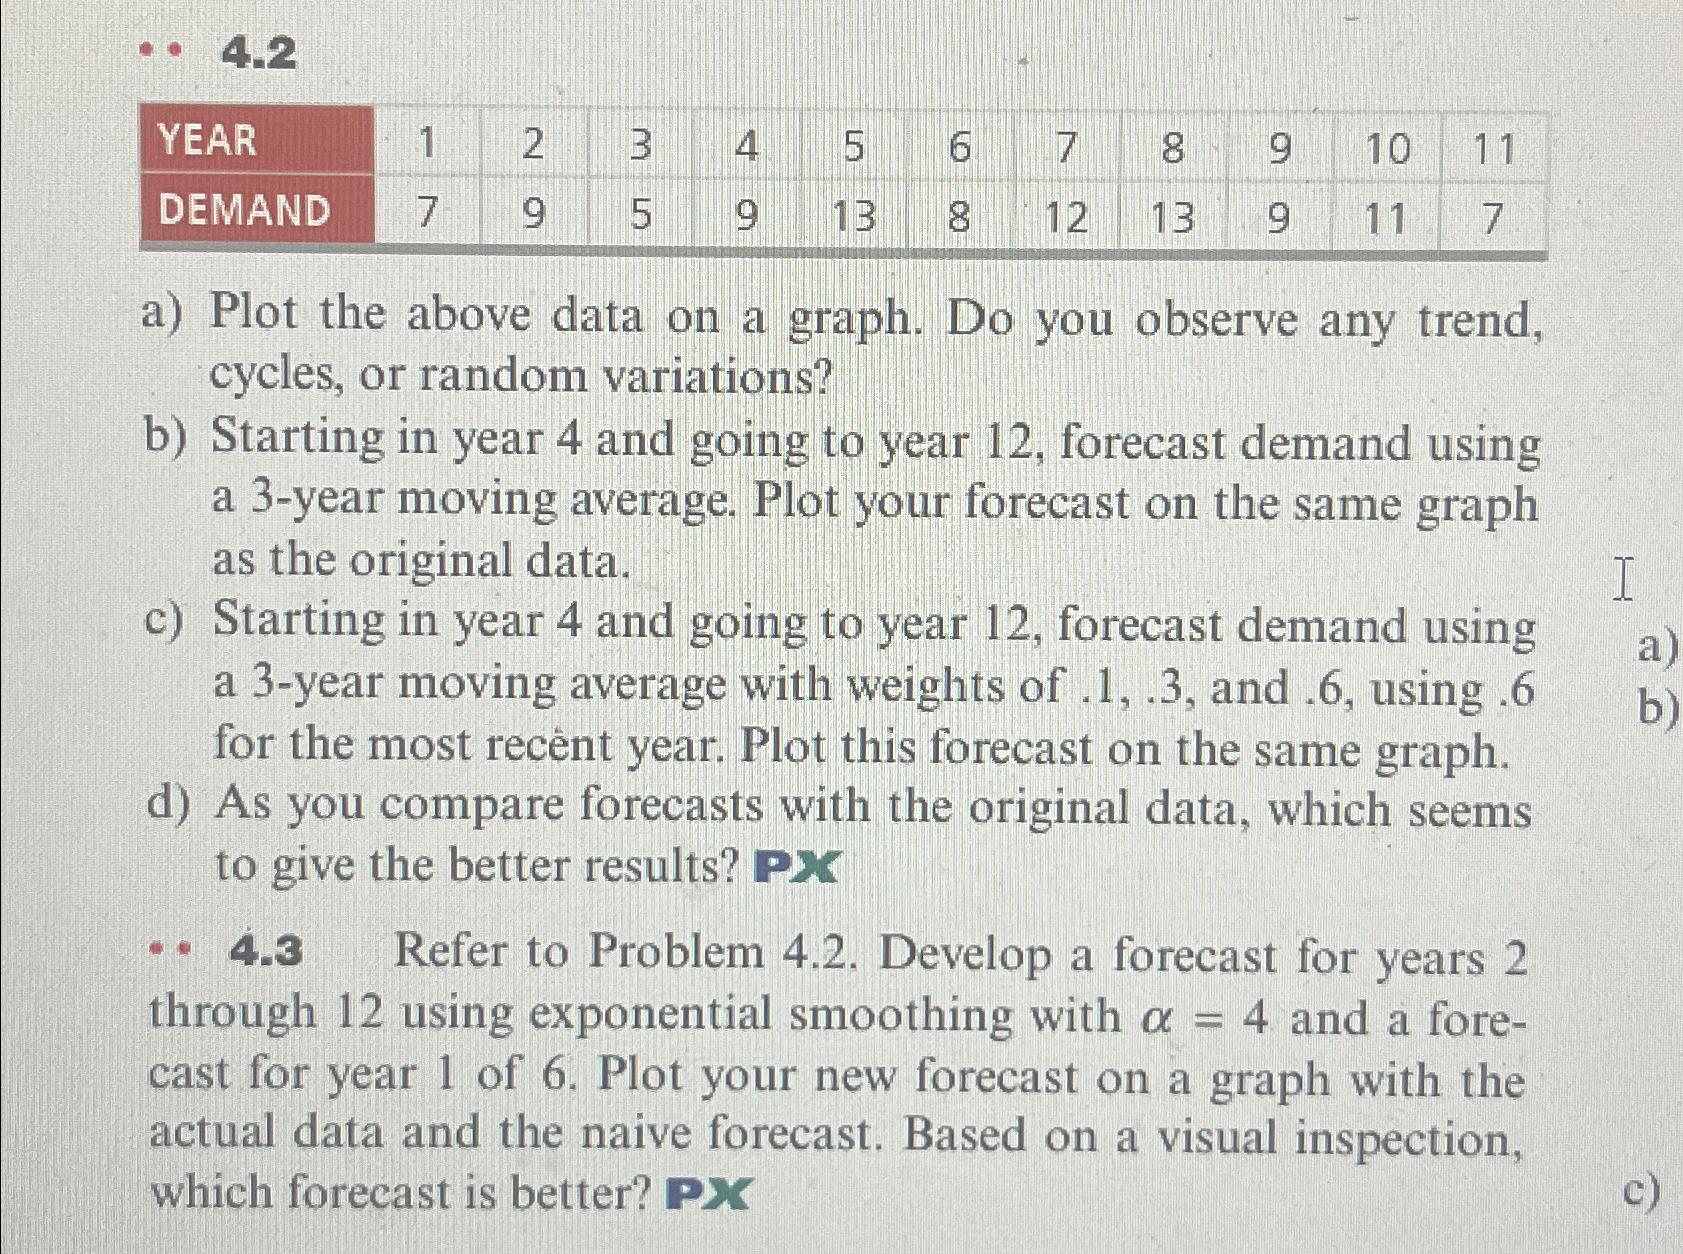
- . 4 . 2 table [ [ YEAR , 1 , 2 , 3 , 4 , 5 , 6 , 7 ,
tableYEARDEMAND
Refer to Problem Develop a forecast for years through using exponential smoothing with and a forecast for year of Plot your new forecast on a graph with the actual data and the naive forecast. Based on a visual inspection, which forecast is better? PX
c

Step by Step Solution
There are 3 Steps involved in it
Step: 1

Get Instant Access to Expert-Tailored Solutions
See step-by-step solutions with expert insights and AI powered tools for academic success
Step: 2

Step: 3

Ace Your Homework with AI
Get the answers you need in no time with our AI-driven, step-by-step assistance
Get Started


