Answered step by step
Verified Expert Solution
Link Copied!

Question

1 Approved Answer

6. (5 points) This question is similar to Exercise 14 on page 363 of the textbook. The population is normally distributed. A sample produced the
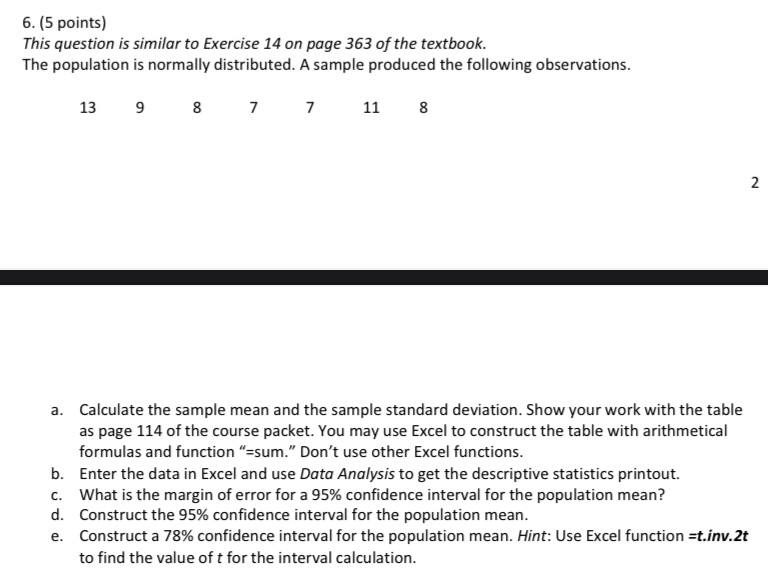
image text in transcribed
6. (5 points) This question is similar to Exercise 14 on page 363 of the textbook. The population is normally distributed. A sample produced the following observations. 13 9 8 7 7 11 8 2 a. Calculate the sample mean and the sample standard deviation. Show your work with the table as page 114 of the course packet. You may use Excel to construct the table with arithmetical formulas and function "=sum." Don't use other Excel functions. b. Enter the data in Excel and use Data Analysis to get the descriptive statistics printout. c. What is the margin of error for a 95% confidence interval for the population mean? d. Construct the 95% confidence interval for the population mean. e. Construct a 78% confidence interval for the population mean. Hint: Use Excel function =t.inv.2t to find the value of t for the interval calculation

Step by Step Solution

There are 3 Steps involved in it

Step: 1

blur-text-image

Get Instant Access to Expert-Tailored Solutions

See step-by-step solutions with expert insights and AI powered tools for academic success

Step: 2

blur-text-image

Step: 3

blur-text-image

Ace Your Homework with AI

Get the answers you need in no time with our AI-driven, step-by-step assistance

Get Started

Recommended Textbook for

Finite Mathematics

Authors: Stefan Waner, Jerry Lee Ford Jr, Waner/Costenoble, Steven Costenoble

5th Edition

1111789304, 9781111789305

More Books

Students also viewed these Mathematics questions