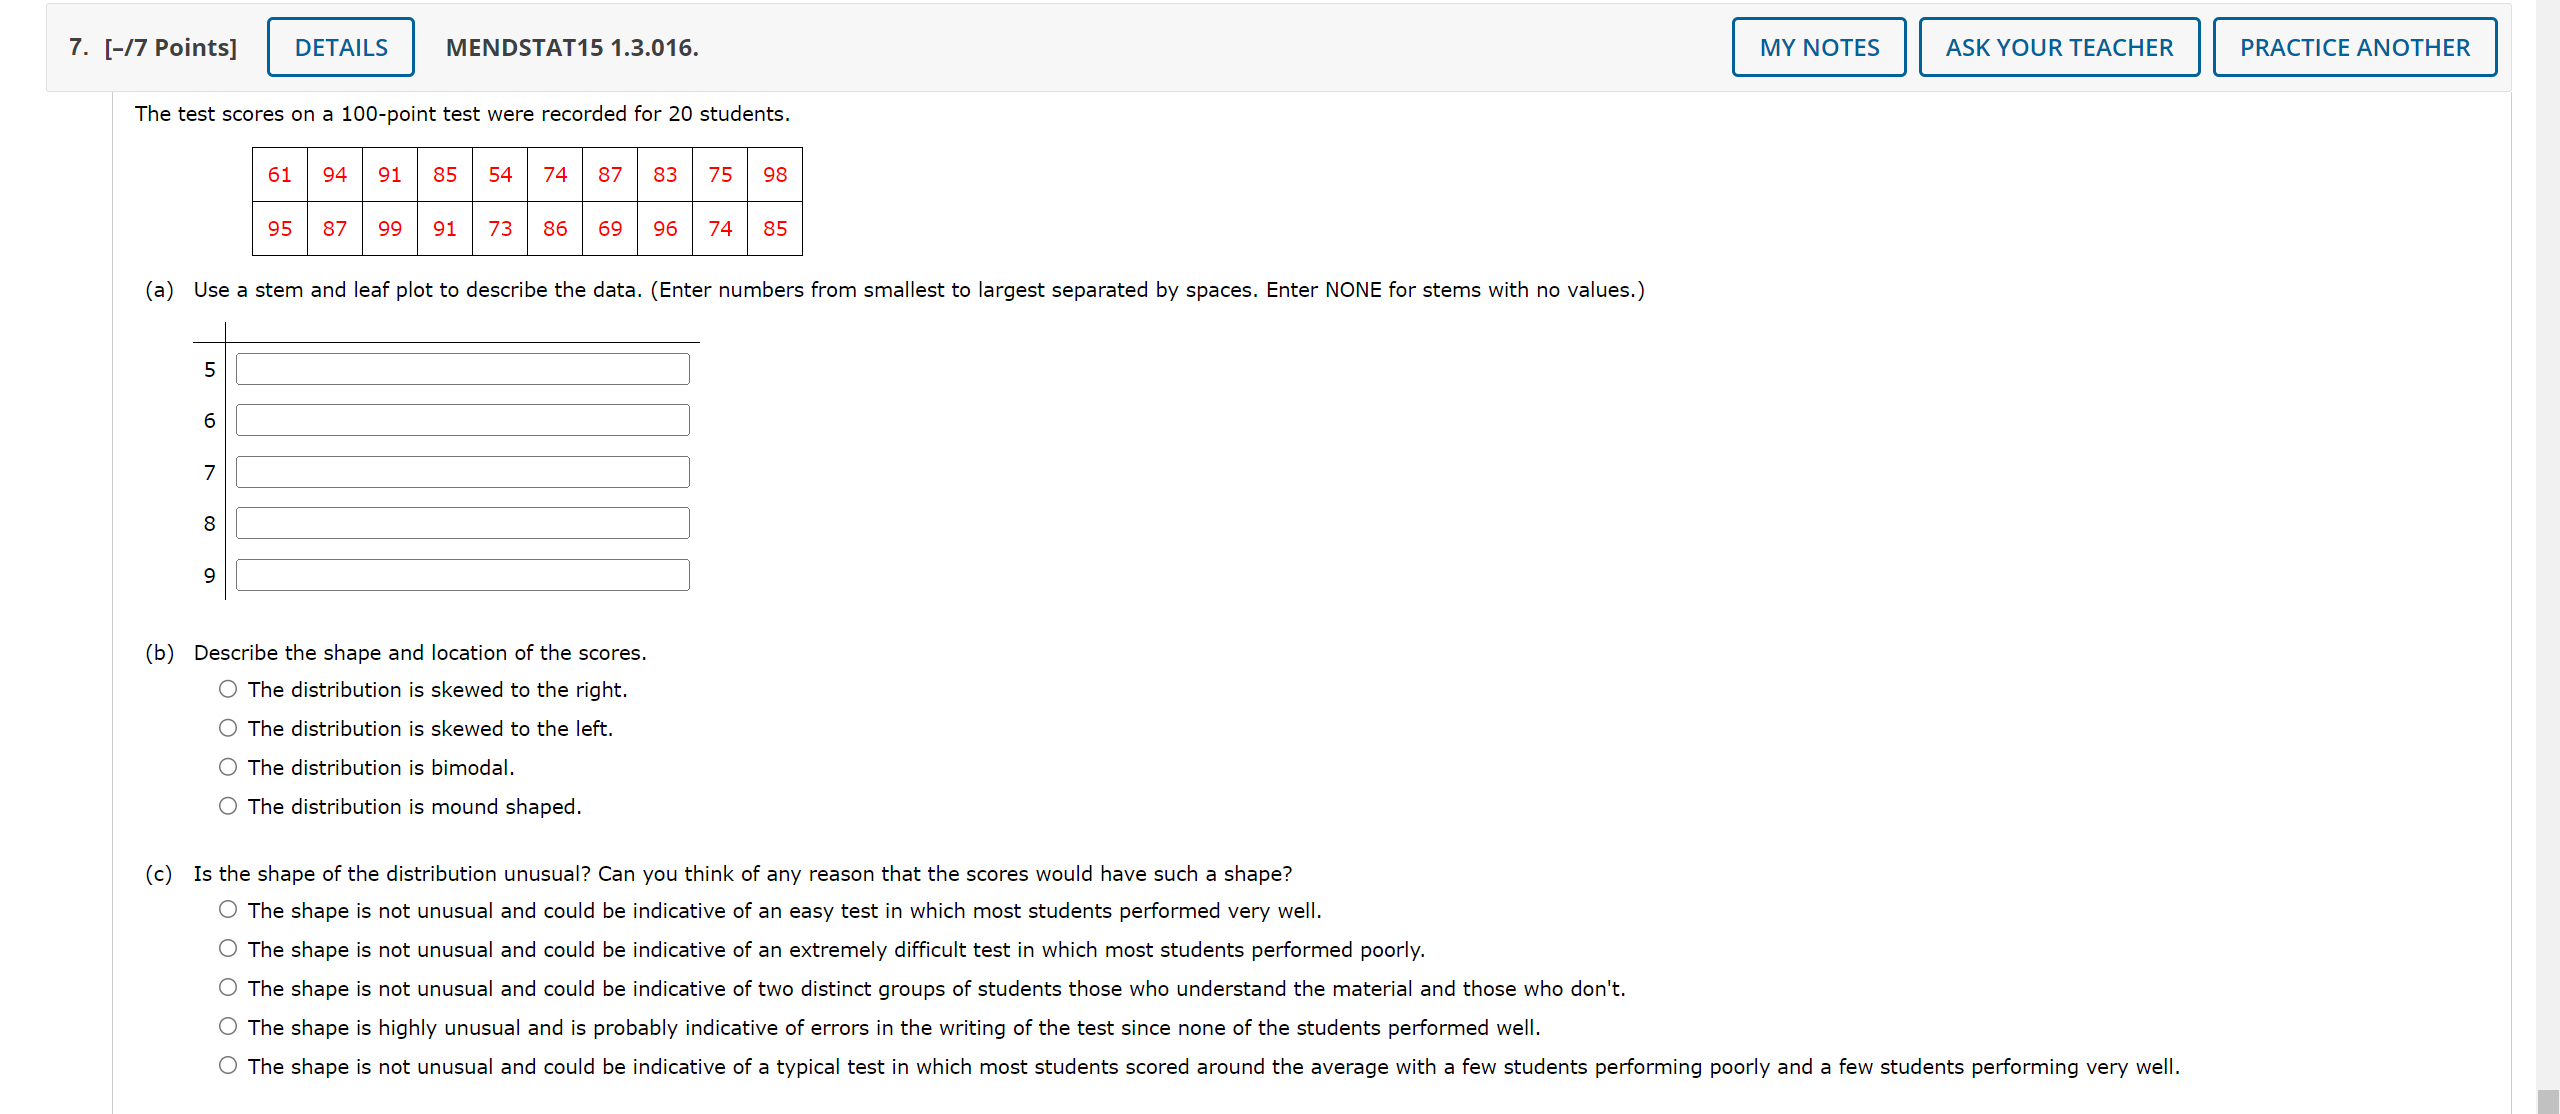
7. [-/7 Points] MENDSTAT15 1.3.016. ASK YOUR TEACHER PRACTICE ANOTHER The test scores on a loo-point test were recorded for 20 students. 61 94 91
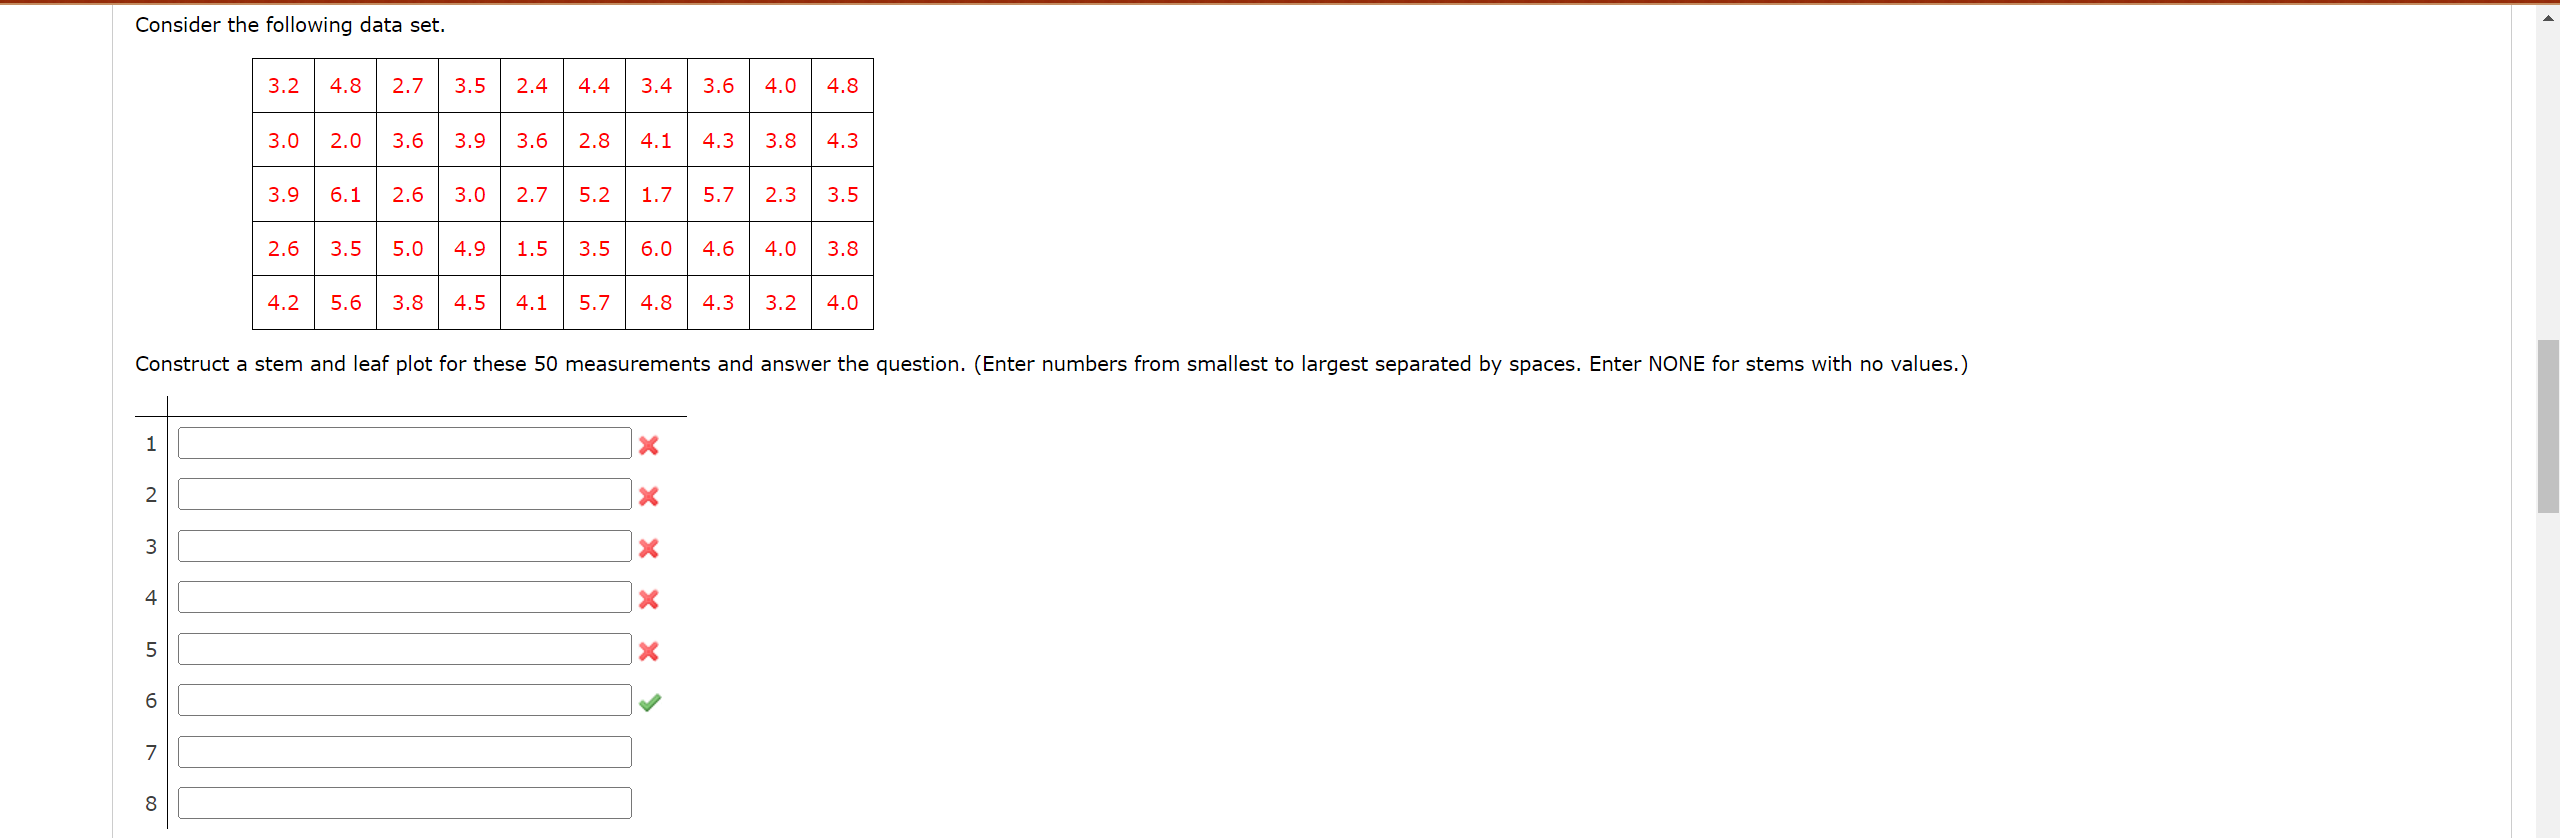
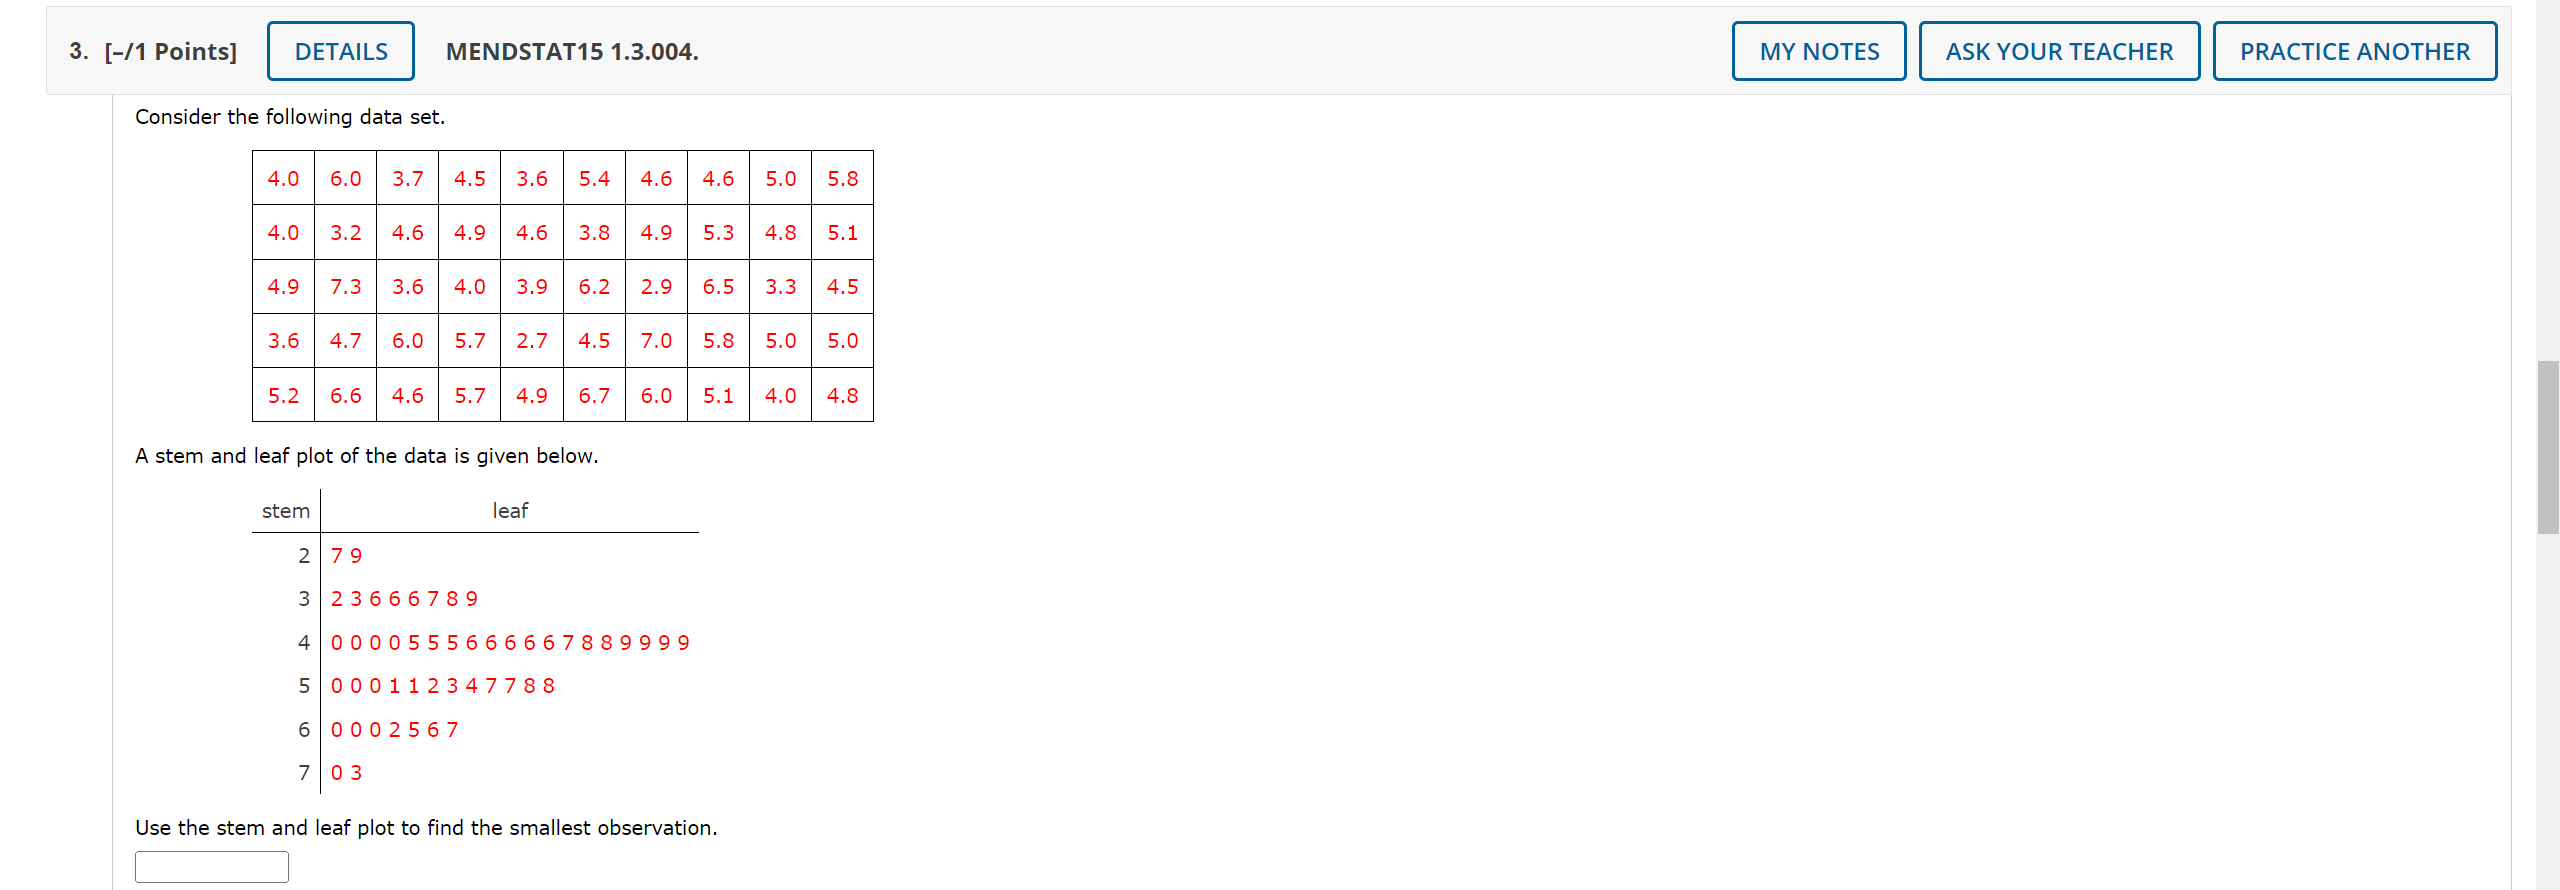
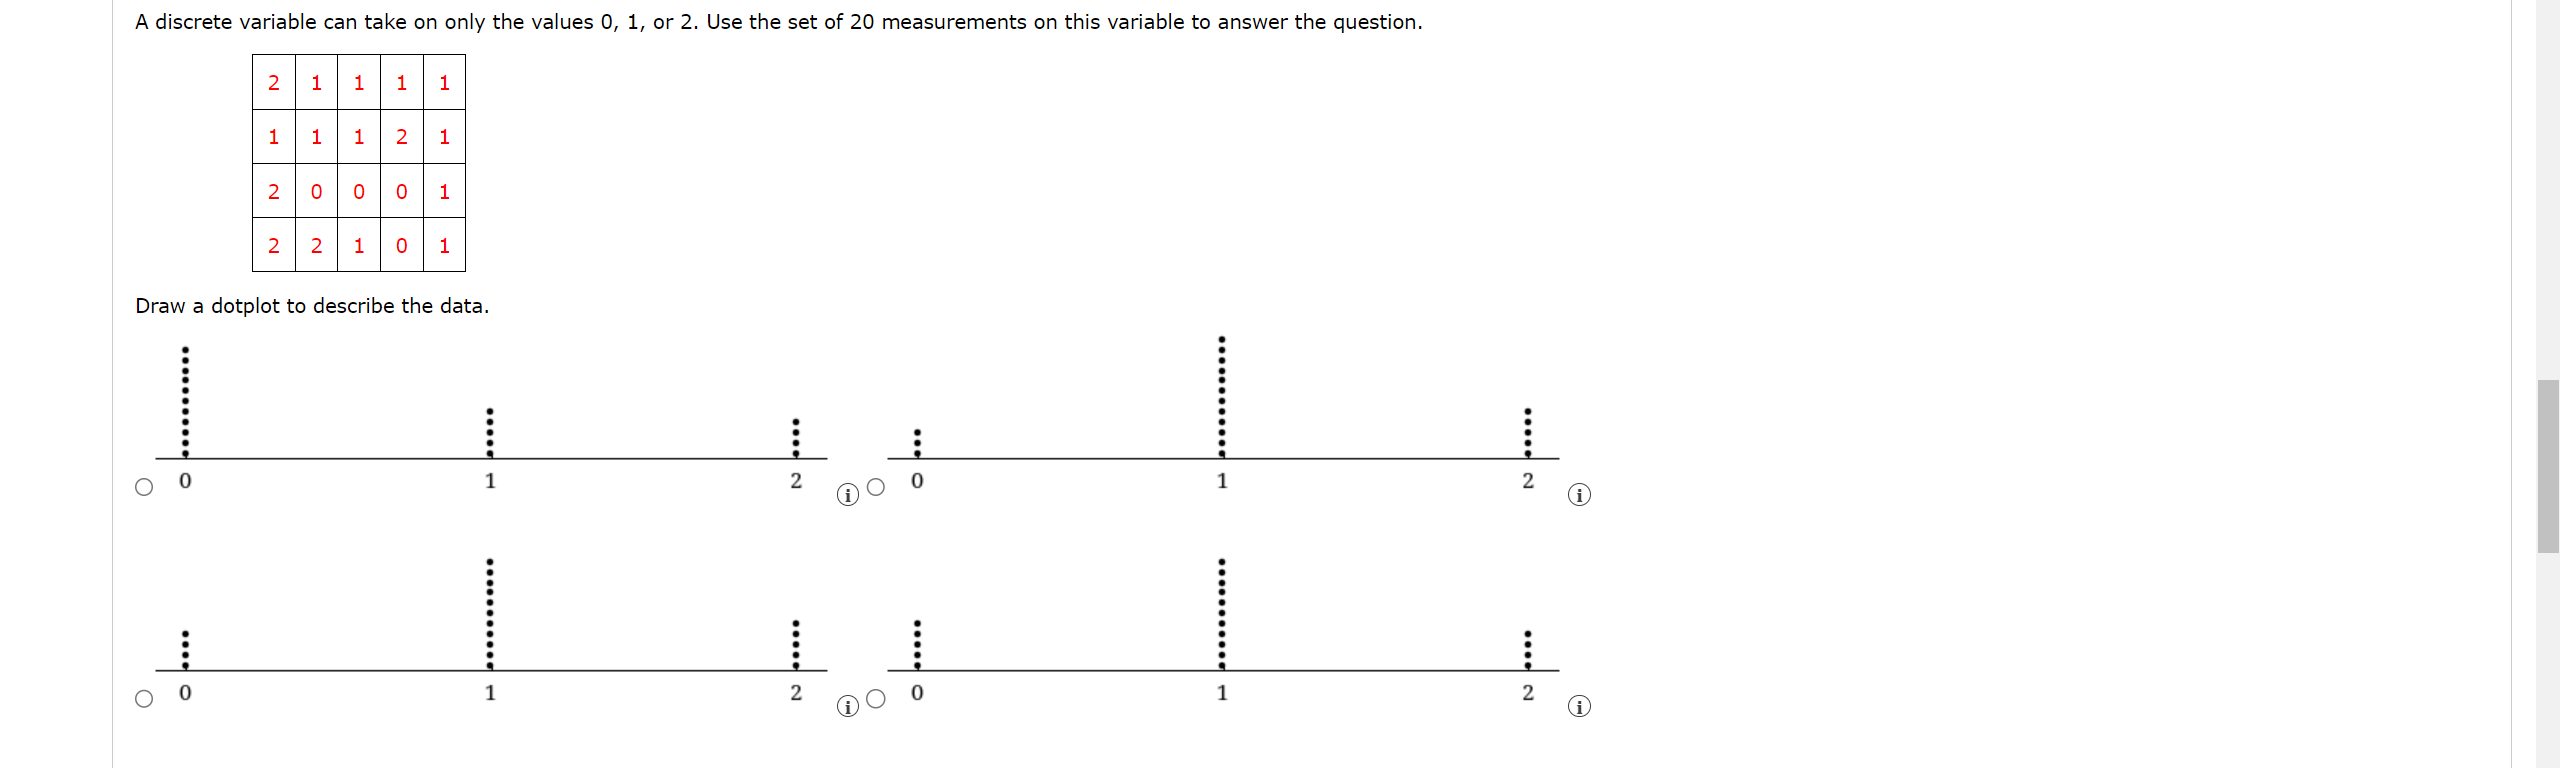
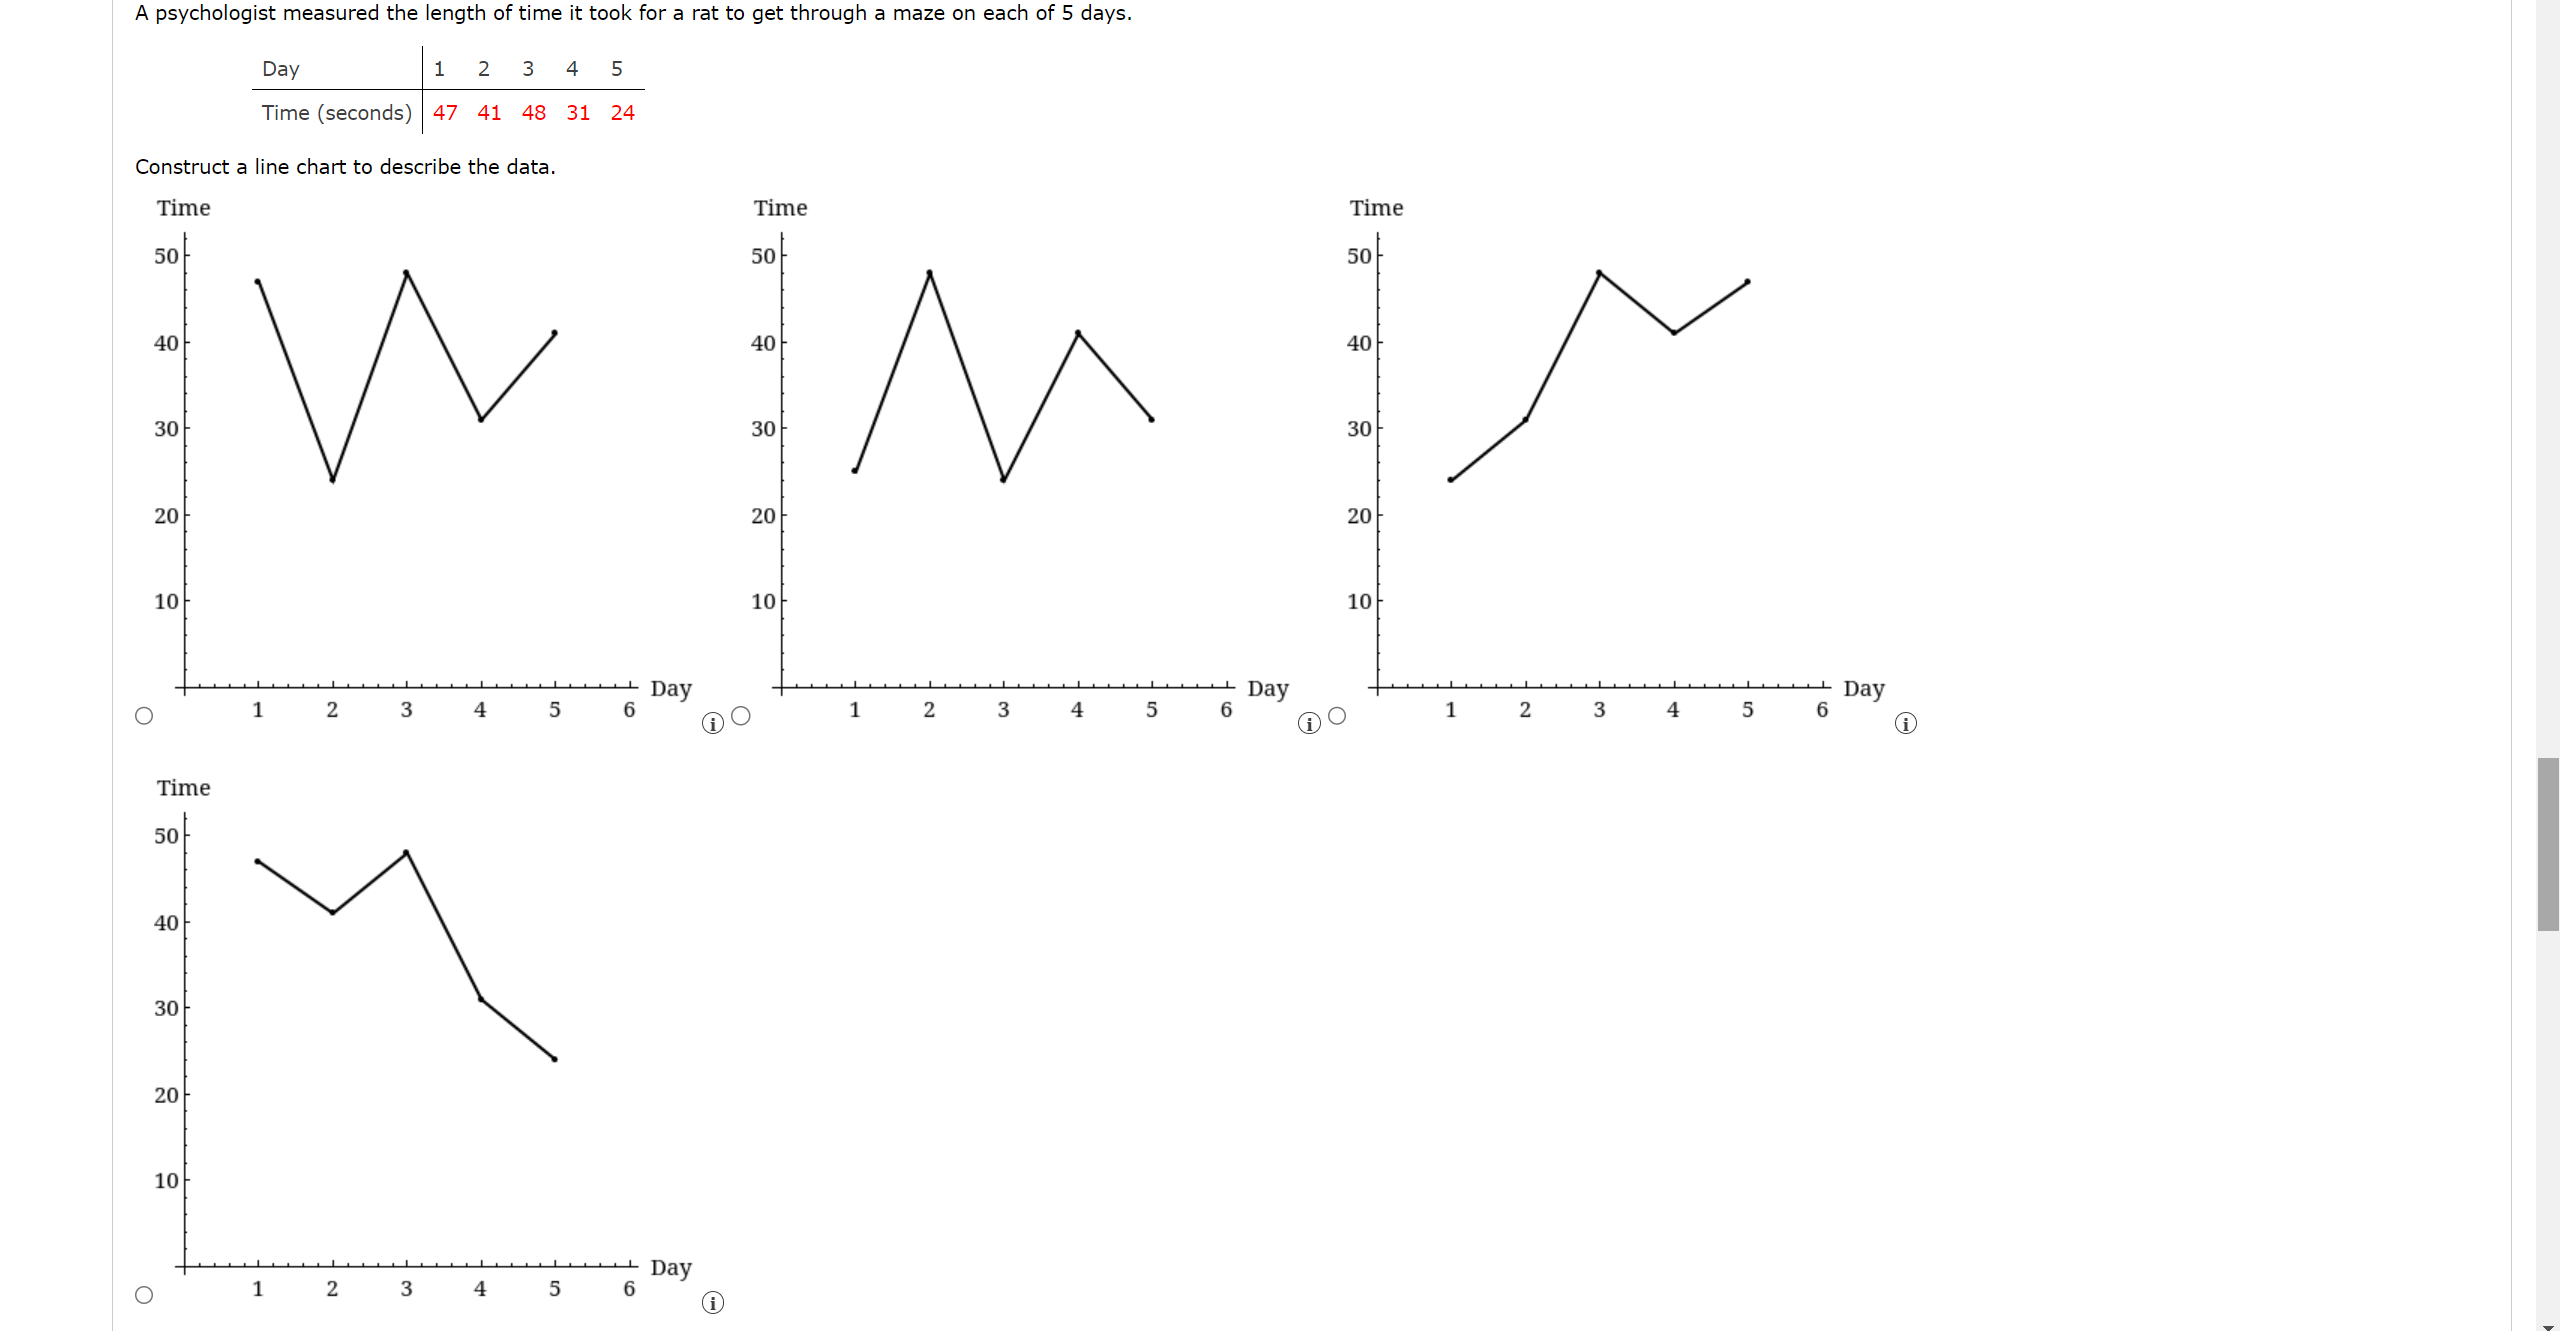
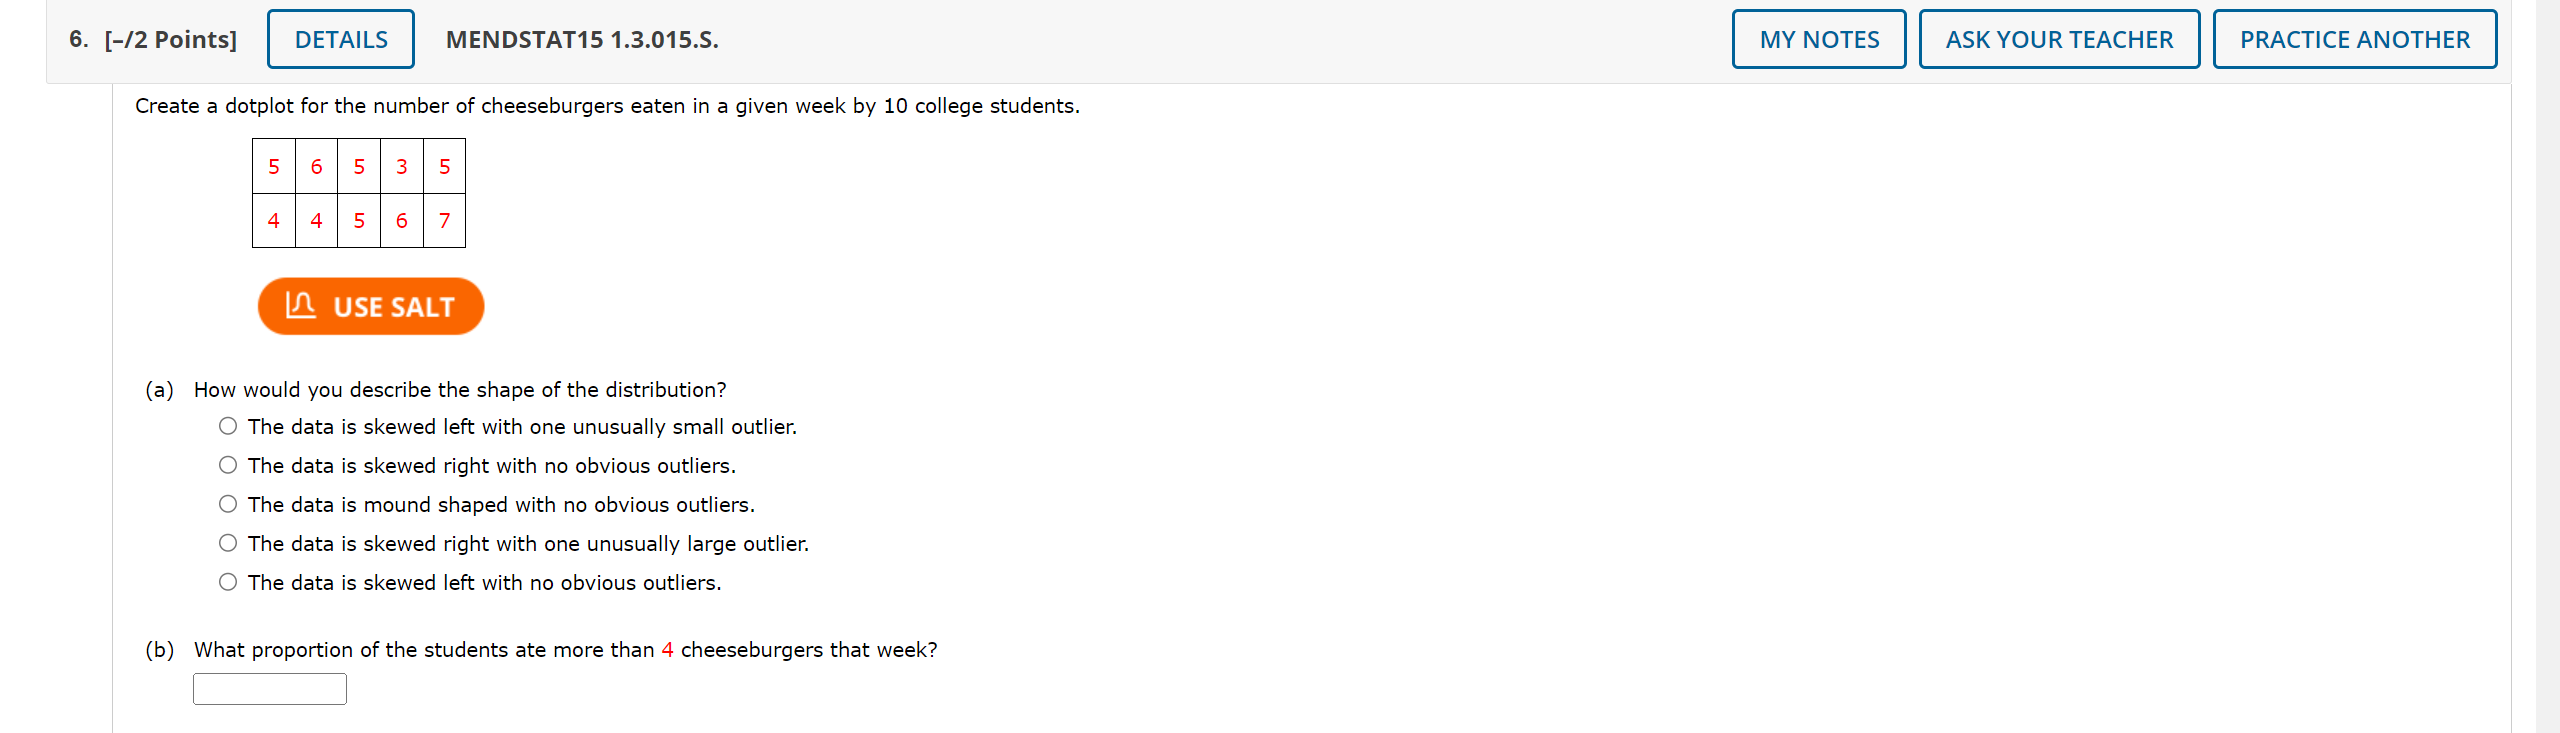
7. [-/7 Points] MENDSTAT15 1.3.016. ASK YOUR TEACHER PRACTICE ANOTHER The test scores on a loo-point test were recorded for 20 students. 61 94 91 85 54 74 87 83 75 98 95 B7 99 91 73 86 69 96 74 85 (a) Use a stem and leaf plot to describe the data. (Enter numbers from smallest to largest separated by spaces. Enter NONE for stems with no values.) (b) Describe the shape and location of the scores. 0 The distribution is skewed to the right. 0 The distribution is skewed to the left. 0 The distribution is bimodal. O The distribution is mound shaped. (c) 15 the shape of the distribution unusual? Can you think of any reason that the scores would have such a shape? 0 The shape is not unusual and could be indicative of an easy test in which most students performed very well. 0 The shape is not unusual and could be indicative of an extremely difcult test in which most students performed poorly. O The shape is not unusual and could be indicative of two distinct groups of students those who understand the material and those who don't. 0 The shape is highly unusual and is probably indicative of errors in the writing of the test since none of the students performed well. 0 The shape is not unusual and could be indicative of a typical test in which most students scored around the average with a few students performing poorly and a few students performing very well. Consider the following data set. 3.2 4.8 2.7 3.5 2.4 4.4 3.4 3.6 4.0 4.8 3.0 2.0 3.6 3.9 3.6 2.8 4.1 4.3 3.8 4.3 3.9 6.1 2.6 3.0 2.7 5.2 1.7 5.7 2.3 3.5 2.6 3.5 5.0 4.9 1.5 3.5 6.0 4.6 4.0 3.8 4.2 5.6 3.8 4.5 4.1 5.7 4.8 4,3 3.2 4.0 Construct a stern and leaf plot for these 50 measurements and answer the question. (Enter numbers from smallest to largest separated by spaces. Enter NONE for stems with no values.) 3. [-/1 Points] DETAILS MENDSTAT15 1.3.004. MY NOTES ASK YOUR TEACHER PRACTICE ANOTHER Consider the following data set. 4.0 6.0 3.7 4.5 3.6 5,4 4,6 4.6 5.0 5.8 4,0 3.2 4.6 4.9 4.6 3.8 4.9 5,3 48 5.1 4.9 7.3 3.6 4.0 3.9 6.2 2.9 5.5 3.3 4.5 3.6 4.7 6.C 5,7 2.7 4.5 7.C 5,8 5,C 5.0 5.2 6.6 4.6 5.7 4.9 6.0 5.1 4.0 4.8 A stem and leaf plot of the data is given below. stem leaf 2 79 3 23666789 0 0 0 0 5 5 5666667889999 5 000112347 788 6 0002567 7 0 3 Use the stem and leaf plot to find the smallest observation.A discrete variable can take on only the values 0, 1, or 2. Use the set of 20 measurements on this variable to answer the question. 2 1 1 1 L 2 1 1 Draw a dotplot to describe the data. .. . . ........ ... N..... ..... N... O 0 0 i .. . . . ...... . . . ....... . . ... N..... N.... O 0 0A psychologist measured the length of time it took for a rat to get through a maze on each of 5 days. Day 2 3 4 5 Time (seconds) 47 41 48 31 24 Construct a line chart to describe the data. Time Time Time 50 50 50 40 40 M 40 30 30 30 20 20 20 10 10- 10 Day - Day Day O 1 2 3 4 5 6 1 2 3 4 5 6 1 2 3 4 5 6 Time 50 40 30 20 10 Day O 1 2 3 4 5 6Do you think that any learning is taking place? 0 The line chart does not suggest that learning is taking place, since over the course of the experiment the time tends to increase as the number of days increases. 0 The line chart suggests that learning is taking place, since over the course of the experiment the time tends to increase as the number of days increases. 0 The line chart does not suggest that learning is taking place, since over the course of the experiment the time tends to does not appear to increase or decrease as the number of days increases. 0 The line chart suggests that learning is taking place, since over the course of the experiment the time does not appear to increase or decrease as the number of days increases. 0 The line chart suggests that learning is taking place, since over the course of the experiment the time tends to decrease as the number of days increases. 6. [-/2 Points] DETAILS MENDSTAT15 1.3.015.S. MY NOTES ASK YOUR TEACHER PRACTICE ANOTHER Create a dotplot for the number of cheeseburgers eaten in a given week by 10 college students. 5 6 5 3 5 4 4 5 6 In USE SALT (a) How would you describe the shape of the distribution? O The data is skewed left with one unusually small outlier. O The data is skewed right with no obvious outliers. The data is mound shaped with no obvious outliers. O The data is skewed right with one unusually large outlier. O The data is skewed left with no obvious outliers. (b) What proportion of the students ate more than 4 cheeseburgers that week
Step by Step Solution
There are 3 Steps involved in it
Step: 1
Get Instant Access to Expert-Tailored Solutions
See step-by-step solutions with expert insights and AI powered tools for academic success
Step: 2
Step: 3
Ace Your Homework with AI
Get the answers you need in no time with our AI-driven, step-by-step assistance