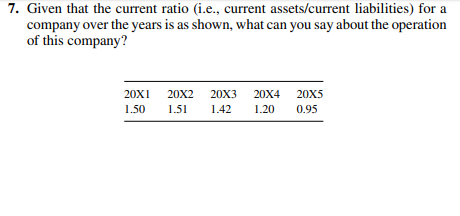
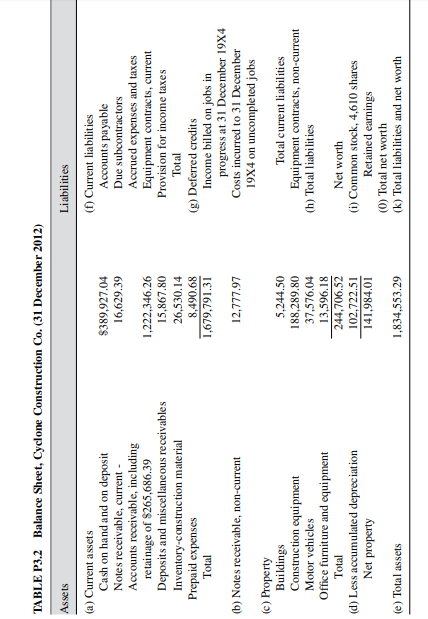
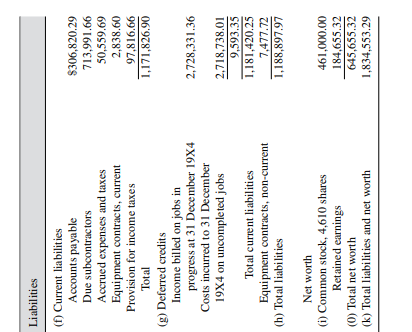
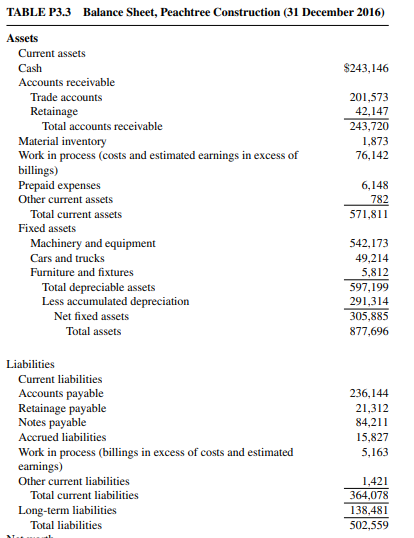
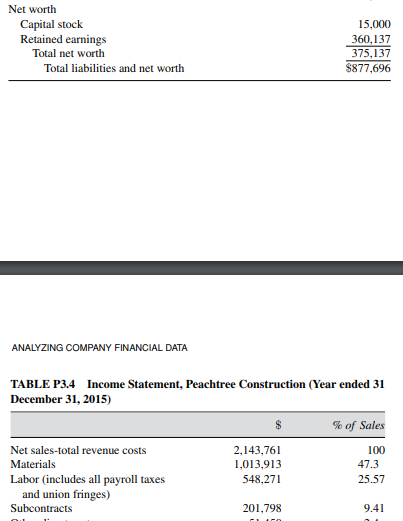
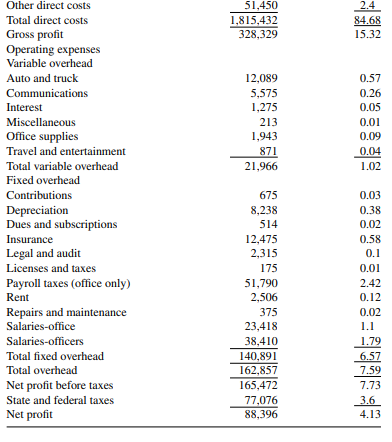
7. Given that the current ratio (i.e., current assets/current liabilities) for a company over the years is as shown, what can you say about the operation of this company? 20x120x2 1.50 1.51 20x3 1.42 20x4 20X5 1.20 0.95 TABLE P3.2 Balance Sheet, Cyclone Construction Co. (31 December 2012) Assets $389,927.04 16,629.39 (a) Current assets Cash on hand and on deposit Notes receivable, current - Accounts receivable, including retai nage of $265,686.39 Deposits and miscellaneous receivables Inventory-construction material Prepaid expenses Total 1,222,346.26 15,867.80 26,530.14 8,490.68 1,679,791.31 Liabilities (f) Current liabilities Accounts payable Due subcontractors Accrued expenses and taxes Equipment contracts, current Provision for income taxes Total (g) Deferred credits Income billed on jobs in progress at 31 December 1974 Costs incurred to 31 December 19X4 on uncompleted jobs 6) Notes receivable, non-current 12.777.97 Total current liabilities Equipment contracts, non-current (h) Total liabilities (c) Property Buildings Construction equipment Motor vehicles Office furniture and equipment Total (d) Less accumulated depreciation Net property 5,244.50 188,289.80 37,576.04 13,596.18 244,706.52 102.722.51 141,984.01 Net worth (1) Common stock, 4,610 shares Retained earnings (0) Total net worth (k) Total liabilities and net worth (e) Total assets 1,834,553.29 Liabilities (1) Current liabilities Accounts payable Due subcontractors Accrued expenses and taxes Equipment contracts, current Provision for income taxes Total (g) Deferred credits Income billed on jobs in progress at 31 December 1984 Costs incurred to 31 December 19X4 on uncompleted jobs 8306,820.29 713,991.66 50,559.69 2.838.60 97,816.66 1,171,826,90 2,728,331.36 Total current liabilities Equipment contracts, non-current (h) Total liabilities 2,718,738.01 9,593.35 1,181,420.25 7,477.72 1,188,897.97 Net worth (1) Common stock, 4,610 shares Retained earnings (0) Total net worth (k) Total liabilities and net worth 461,000.00 184,655.32 645,655.32 1,834,553.29 TABLE P3.3 Balance Sheet, Peachtree Construction (31 December 2016) $243,146 201,573 42,147 243,720 1,873 76,142 Assets Current assets Cash Accounts receivable Trade accounts Retainage Total accounts receivable Material inventory Work in process (costs and estimated earnings in excess of billings) Prepaid expenses Other current assets Total current assets Fixed assets Machinery and equipment Cars and trucks Furniture and fixtures Total depreciable assets Less accumulated depreciation Net fixed assets Total assets 6,148 782 571,811 542,173 49,214 5,812 597,199 291,314 305.885 877,696 Liabilities Current liabilities Accounts payable Retainage payable Notes payable Accrued liabilities Work in process (billings in excess of costs and estimated earnings) Other current liabilities Total current liabilities Long-term liabilities Total liabilities 236,144 21,312 84,211 15,827 5,163 1,421 364,078 138,481 502,559 Net worth Capital stock Retained earnings Total net worth Total liabilities and net worth 15.000 360,137 375.137 $877,696 ANALYZING COMPANY FINANCIAL DATA TABLE P3.4 Income Statement, Peachtree Construction (Year ended 31 December 31, 2015) $ % of Sales Net sales-total revenue costs 2.143.761 100 Materials 1.013.913 47.3 Labor (includes all payroll taxes 548,271 25.57 and union fringes) Subcontracts 201.798 2.4 51.450 1.815,432 328,329 84.68 15.32 12,089 5,575 1,275 213 1.943 871 21,966 0.57 0.26 0.05 0.01 0.09 0.04 1.02 Other direct costs Total direct costs Gross profit Operating expenses Variable overhead Auto and truck Communications Interest Miscellaneous Office supplies Travel and entertainment Total variable overhead Fixed overhead Contributions Depreciation Dues and subscriptions Insurance Legal and audit Licenses and taxes Payroll taxes (office only) Rent Repairs and maintenance Salaries-office Salaries-officers Total fixed overhead Total overhead Net profit before taxes State and federal taxes Net profit 675 8.238 514 12,475 2.315 0.03 0.38 0.02 0.58 0.1 0.01 2.42 0.12 0.02 175 51,790 2.506 375 23,418 38,410 140.891 162.857 165,472 77,076 88,396