926
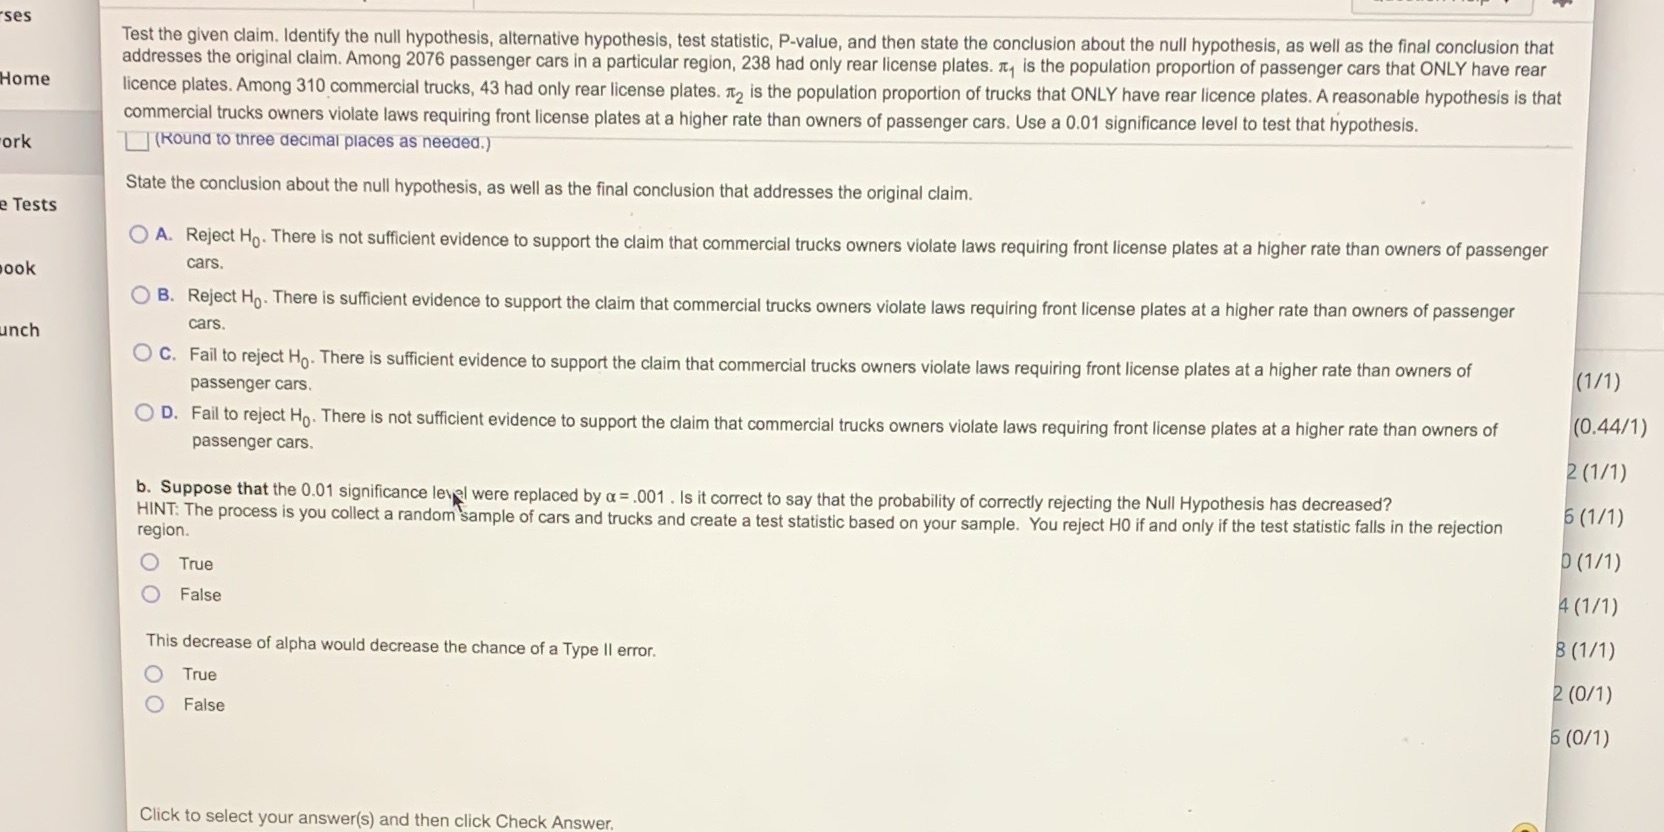
'ses Test the given claim. Identify the null hypothesis, alternative hypothesis, test statistic, P-value, and then state the conclusion about the null hypothesis, as well as the final conclusion that addresses the original claim. Among 2076 passenger cars in a particular region, 238 had only rear license plates. It, is the population proportion of passenger cars that ONLY have rear Home licence plates. Among 310 commercial trucks, 43 had only rear license plates. 2 is the population proportion of trucks that ONLY have rear licence plates. A reasonable hypothesis is that commercial trucks owners violate laws requiring front license plates at a higher rate than owners of passenger cars. Use a 0.01 significance level to test that hypothesis. ork (Round to three decimal places as needed.) State the conclusion about the null hypothesis, as well as the final conclusion that addresses the original claim. Tests O A. Reject Ho. There is not sufficient evidence to support the claim that commercial trucks owners violate laws requiring front license plates at a higher rate than owners of passenger ook cars. O B. Reject Ho. There is sufficient evidence to support the claim that commercial trucks owners violate laws requiring front license plates at a higher rate than owners of passenger unch cars. O C. Fail to reject Ho. There is sufficient evidence to support the claim that commercial trucks owners violate laws requiring front license plates at a higher rate than owners of (1/1) passenger cars. O D. Fail to reject Ho. There is not sufficient evidence to support the claim that commercial trucks owners violate laws requiring front license plates at a higher rate than owners of (0.44/1) passenger cars. 2 (1/1) b. Suppose that the 0.01 significance level were replaced by a = .001 . Is it correct to say that the probability of correctly rejecting the Null Hypothesis has decreased? HINT: The process is you collect a random sample of cars and trucks and create a test statistic based on your sample. You reject HO if and only if the test statistic falls in the rejection 6 (1/1) region. D (1/1) O True O False 4 (1/1) This decrease of alpha would decrease the chance of a Type II error. B (1/1) True 2 (0/1) O False 6 (0/1) Click to select your answer(s) and then click Check


