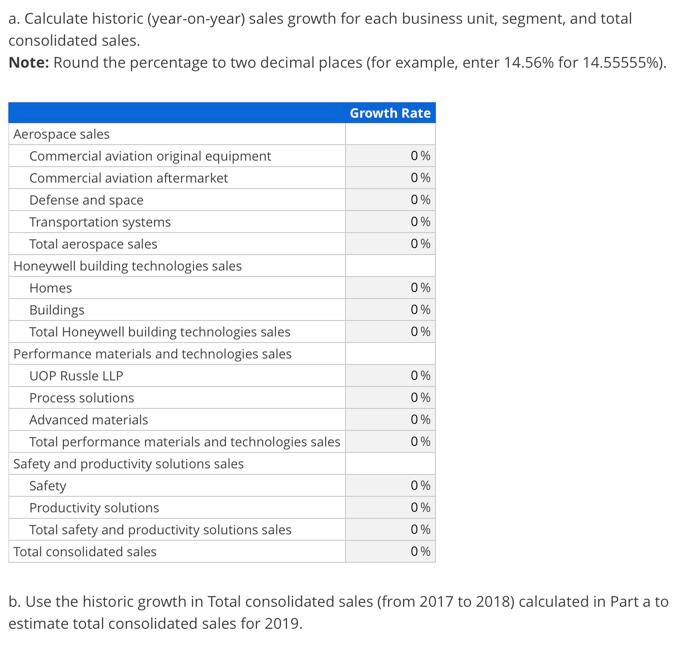
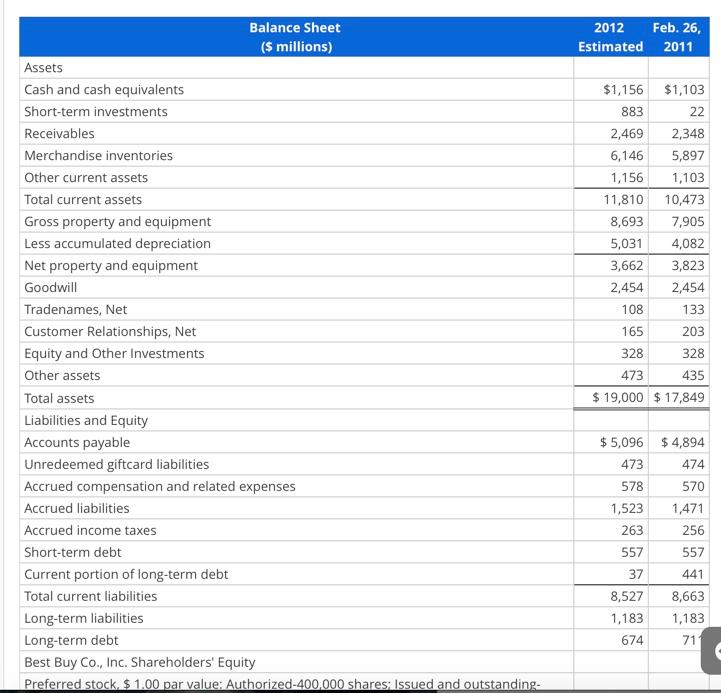
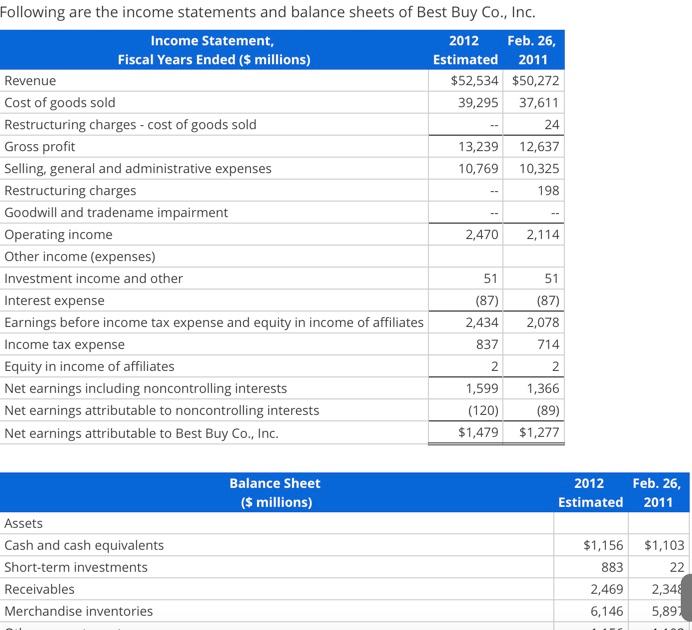
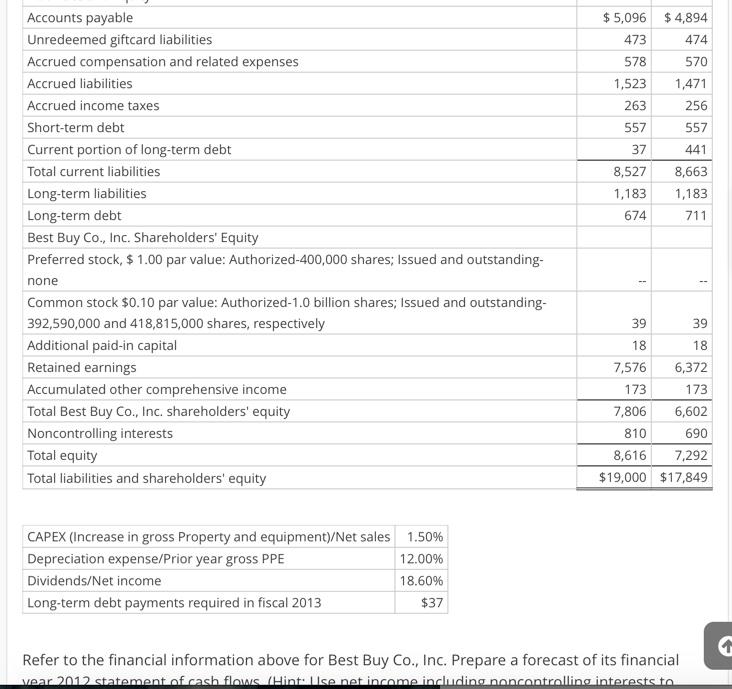
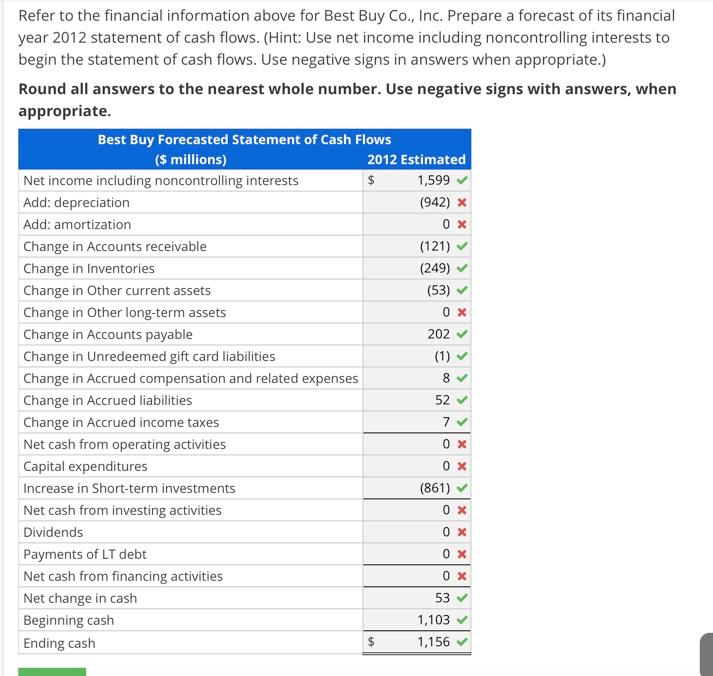
a. Calculate historic (year-on-year) sales growth for each business unit, segment, and total consolidated sales. Note: Round the percentage to two decimal places (for example, enter 14.56% for 14.55555%). Growth Rate 0 % 0 % 0 % 0 % 0% 0 % 0% 0% Aerospace sales Commercial aviation original equipment Commercial aviation aftermarket Defense and space Transportation systems Total aerospace sales Honeywell building technologies sales Homes Buildings Total Honeywell building technologies sales Performance materials and technologies sales UOP Russle LLP Process solutions Advanced materials Total performance materials and technologies sales Safety and productivity solutions sales Safety Productivity solutions Total safety and productivity solutions sales Total consolidated sales 0% 0 % 0% 0% 0% 0% 0 % 0 % b. Use the historic growth in Total consolidated sales (from 2017 to 2018) calculated in Part a to estimate total consolidated sales for 2019. 2012 Estimated Feb. 26, 2011 $1,156 $1,103 22 883 2,348 2,469 6,146 1,156 11,810 8,693 5,031 3,662 2,454 108 5,897 1,103 10,473 7,905 4,082 3,823 2,454 133 165 203 Balance Sheet ($ millions) Assets Cash and cash equivalents Short-term investments Receivables Merchandise inventories Other current assets Total current assets Gross property and equipment Less accumulated depreciation Net property and equipment Goodwill Tradenames, Net Customer Relationships, Net Equity and Other Investments Other assets Total assets Liabilities and Equity Accounts payable Unredeemed giftcard liabilities Accrued compensation and related expenses Accrued liabilities Accrued income taxes Short-term debt Current portion of long-term debt Total current liabilities Long-term liabilities Long-term debt Best Buy Co., Inc. Shareholders' Equity Preferred stock. $ 1.00 par value: Authorized-400,000 shares. Issued and outstanding- 328 328 473 435 $ 19,000 $ 17,849 $ 5,096 $4,894 473 474 578 570 1,523 1,471 263 256 557 557 37 441 8,527 1,183 674 8,663 1,183 71 Following are the income statements and balance sheets of Best Buy Co., Inc. Income Statement, 2012 Feb. 26, Fiscal Years Ended ($ millions) Estimated 2011 Revenue $52,534 $50,272 Cost of goods sold 39,295 37,611 Restructuring charges - cost of goods sold 24 Gross profit 13,239 12,637 Selling, general and administrative expenses 10,769 10,325 Restructuring charges 198 Goodwill and tradename impairment Operating income 2,470 2,114 Other income (expenses) Investment income and other 51 51 Interest expense (87) (87) Earnings before income tax expense and equity in income of affiliates 2,434 2,078 Income tax expense 837 714 Equity in income of affiliates 2 2 Net earnings including noncontrolling interests 1,599 1,366 Net earnings attributable to noncontrolling interests (120) (89) Net earnings attributable to Best Buy Co., Inc. $1,479 $1,277 Balance Sheet ($ millions) 2012 Estimated Feb. 26, 2011 $1,156 $1,103 Assets Cash and cash equivalents Short-term investments Receivables Merchandise inventories 883 22 2,469 6,146 2,348 5,891 $ 5,096 473 $ 4,894 474 578 570 1,471 256 557 Accounts payable Unredeemed giftcard liabilities Accrued compensation and related expenses Accrued liabilities Accrued income taxes Short-term debt Current portion of long-term debt Total current liabilities Long-term liabilities Long-term debt Best Buy Co., Inc. Shareholders' Equity Preferred stock, $ 1.00 par value: Authorized-400,000 shares; Issued and outstanding- 1,523 263 557 37 8,527 1,183 441 8,663 1,183 711 674 none -- -- 39 39 18 18 Common stock $0.10 par value: Authorized-1.0 billion shares; Issued and outstanding- 392,590,000 and 418,815,000 shares, respectively Additional paid-in capital Retained earnings Accumulated other comprehensive income Total Best Buy Co., Inc. shareholders' equity Noncontrolling interests Total equity Total liabilities and shareholders' equity 7,576 6,372 173 173 7,806 6,602 810 690 8,616 7,292 $19,000 $17,849 CAPEX (Increase in gross Property and equipment/Net sales 1.50% Depreciation expense/Prior year gross PPE 12.00% Dividends/Net income 18.60% Long-term debt payments required in fiscal 2013 $37 1 Refer to the financial information above for Best Buy Co., Inc. Prepare a forecast of its financial vear 2012 statement of cash flows. (Hintase net income including noncontrolling interests to Refer to the financial information above for Best Buy Co., Inc. Prepare a forecast of its financial year 2012 statement of cash flows. (Hint: Use net income including noncontrolling interests to begin the statement of cash flows. Use negative signs in answers when appropriate.) Round all answers to the nearest whole number. Use negative signs with answers, when appropriate. Best Buy Forecasted Statement of Cash Flows ($ millions) 2012 Estimated Net income including noncontrolling interests $ 1,599 Add: depreciation (942) X Add: amortization 0 x Change in Accounts receivable (121) Change in Inventories (249) Change in Other current assets (53) Change in other long-term assets 0x Change in Accounts payable 202 Change in Unredeemed gift card liabilities (1) Change in Accrued compensation and related expenses Change in Accrued liabilities Change in Accrued income taxes Net cash from operating activities 0 x Capital expenditures 0x Increase in Short-term investments (861) Net cash from investing activities 0 x Dividends Payments of LT debt 0X Net cash from financing activities 0 x Net change in cash 53 Beginning cash 1,103 Ending cash 1,156 8 52 7 0X $ a. Calculate historic (year-on-year) sales growth for each business unit, segment, and total consolidated sales. Note: Round the percentage to two decimal places (for example, enter 14.56% for 14.55555%). Growth Rate 0 % 0 % 0 % 0 % 0% 0 % 0% 0% Aerospace sales Commercial aviation original equipment Commercial aviation aftermarket Defense and space Transportation systems Total aerospace sales Honeywell building technologies sales Homes Buildings Total Honeywell building technologies sales Performance materials and technologies sales UOP Russle LLP Process solutions Advanced materials Total performance materials and technologies sales Safety and productivity solutions sales Safety Productivity solutions Total safety and productivity solutions sales Total consolidated sales 0% 0 % 0% 0% 0% 0% 0 % 0 % b. Use the historic growth in Total consolidated sales (from 2017 to 2018) calculated in Part a to estimate total consolidated sales for 2019. 2012 Estimated Feb. 26, 2011 $1,156 $1,103 22 883 2,348 2,469 6,146 1,156 11,810 8,693 5,031 3,662 2,454 108 5,897 1,103 10,473 7,905 4,082 3,823 2,454 133 165 203 Balance Sheet ($ millions) Assets Cash and cash equivalents Short-term investments Receivables Merchandise inventories Other current assets Total current assets Gross property and equipment Less accumulated depreciation Net property and equipment Goodwill Tradenames, Net Customer Relationships, Net Equity and Other Investments Other assets Total assets Liabilities and Equity Accounts payable Unredeemed giftcard liabilities Accrued compensation and related expenses Accrued liabilities Accrued income taxes Short-term debt Current portion of long-term debt Total current liabilities Long-term liabilities Long-term debt Best Buy Co., Inc. Shareholders' Equity Preferred stock. $ 1.00 par value: Authorized-400,000 shares. Issued and outstanding- 328 328 473 435 $ 19,000 $ 17,849 $ 5,096 $4,894 473 474 578 570 1,523 1,471 263 256 557 557 37 441 8,527 1,183 674 8,663 1,183 71 Following are the income statements and balance sheets of Best Buy Co., Inc. Income Statement, 2012 Feb. 26, Fiscal Years Ended ($ millions) Estimated 2011 Revenue $52,534 $50,272 Cost of goods sold 39,295 37,611 Restructuring charges - cost of goods sold 24 Gross profit 13,239 12,637 Selling, general and administrative expenses 10,769 10,325 Restructuring charges 198 Goodwill and tradename impairment Operating income 2,470 2,114 Other income (expenses) Investment income and other 51 51 Interest expense (87) (87) Earnings before income tax expense and equity in income of affiliates 2,434 2,078 Income tax expense 837 714 Equity in income of affiliates 2 2 Net earnings including noncontrolling interests 1,599 1,366 Net earnings attributable to noncontrolling interests (120) (89) Net earnings attributable to Best Buy Co., Inc. $1,479 $1,277 Balance Sheet ($ millions) 2012 Estimated Feb. 26, 2011 $1,156 $1,103 Assets Cash and cash equivalents Short-term investments Receivables Merchandise inventories 883 22 2,469 6,146 2,348 5,891 $ 5,096 473 $ 4,894 474 578 570 1,471 256 557 Accounts payable Unredeemed giftcard liabilities Accrued compensation and related expenses Accrued liabilities Accrued income taxes Short-term debt Current portion of long-term debt Total current liabilities Long-term liabilities Long-term debt Best Buy Co., Inc. Shareholders' Equity Preferred stock, $ 1.00 par value: Authorized-400,000 shares; Issued and outstanding- 1,523 263 557 37 8,527 1,183 441 8,663 1,183 711 674 none -- -- 39 39 18 18 Common stock $0.10 par value: Authorized-1.0 billion shares; Issued and outstanding- 392,590,000 and 418,815,000 shares, respectively Additional paid-in capital Retained earnings Accumulated other comprehensive income Total Best Buy Co., Inc. shareholders' equity Noncontrolling interests Total equity Total liabilities and shareholders' equity 7,576 6,372 173 173 7,806 6,602 810 690 8,616 7,292 $19,000 $17,849 CAPEX (Increase in gross Property and equipment/Net sales 1.50% Depreciation expense/Prior year gross PPE 12.00% Dividends/Net income 18.60% Long-term debt payments required in fiscal 2013 $37 1 Refer to the financial information above for Best Buy Co., Inc. Prepare a forecast of its financial vear 2012 statement of cash flows. (Hintase net income including noncontrolling interests to Refer to the financial information above for Best Buy Co., Inc. Prepare a forecast of its financial year 2012 statement of cash flows. (Hint: Use net income including noncontrolling interests to begin the statement of cash flows. Use negative signs in answers when appropriate.) Round all answers to the nearest whole number. Use negative signs with answers, when appropriate. Best Buy Forecasted Statement of Cash Flows ($ millions) 2012 Estimated Net income including noncontrolling interests $ 1,599 Add: depreciation (942) X Add: amortization 0 x Change in Accounts receivable (121) Change in Inventories (249) Change in Other current assets (53) Change in other long-term assets 0x Change in Accounts payable 202 Change in Unredeemed gift card liabilities (1) Change in Accrued compensation and related expenses Change in Accrued liabilities Change in Accrued income taxes Net cash from operating activities 0 x Capital expenditures 0x Increase in Short-term investments (861) Net cash from investing activities 0 x Dividends Payments of LT debt 0X Net cash from financing activities 0 x Net change in cash 53 Beginning cash 1,103 Ending cash 1,156 8 52 7 0X $


