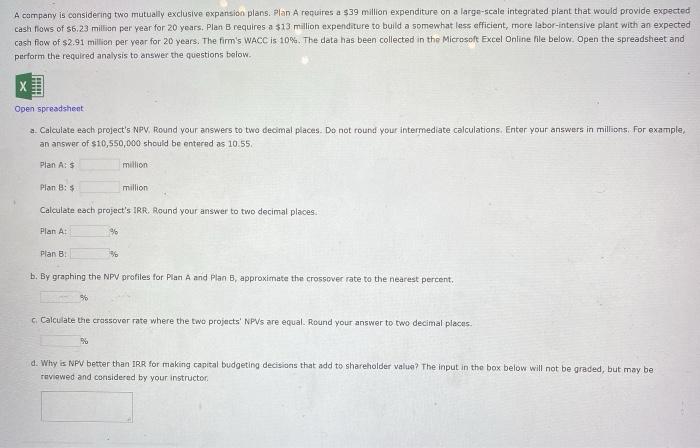
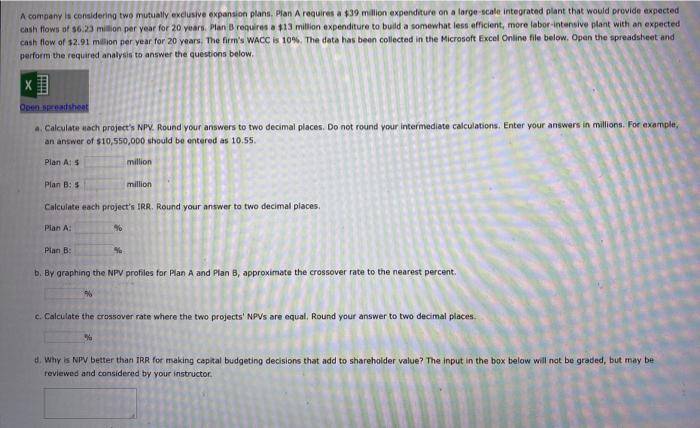
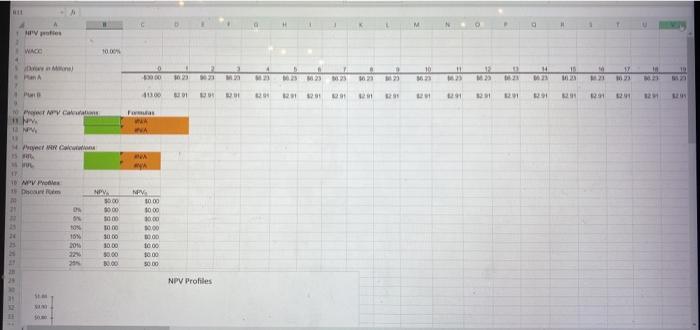
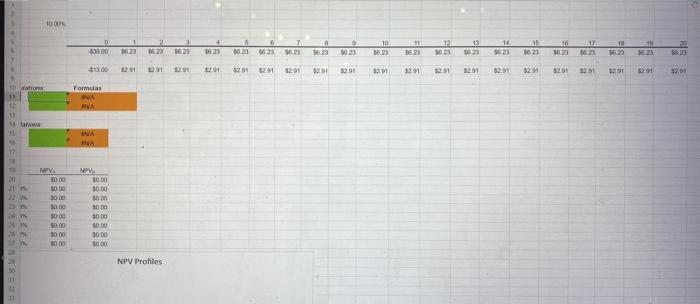
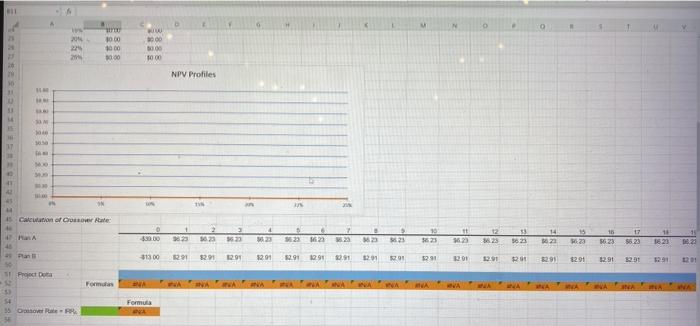
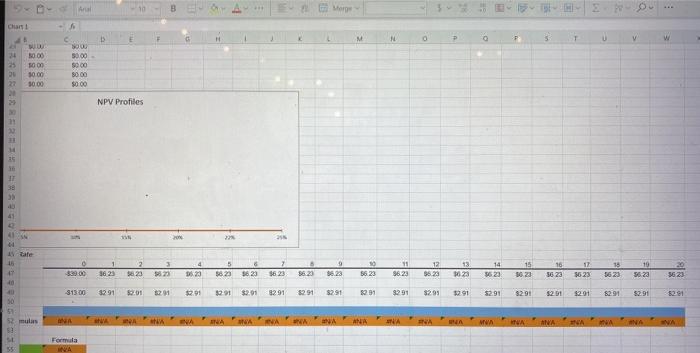
A company is considering two mutually exclusive expansion plans. Plan A requires a $39 million expenditure on a large-scale integrated plant that would provide expected cash flows of $6.23 million per year for 20 years, Plan B requires a $13 million expenditure to build a somewhat less efficient, more labor-intensive plant with an expected cash flow of $2.91 million per year for 20 years. The firm's WACC is 10%. The data has been collected in the Microsoft Excel Online file below. Open the spreadsheet and perform the required analysis to answer the questions below Open spreadsheet a. Calculate each project's NPV. Round your answers to two decimal places. Do not round your intermediate calculations. Enter your answers in millions. For example, an answer of $10,550,000 should be entered as 10.55. Plan A:s million Plan B: $ million Calculate each project's IRR. Round your answer to two decimal places Plan A: plan B b. By graphing the NPV profiles for Plan A and Plan B, approximate the crossover rate to the nearest percent. Calculate the crossover rate where the two projects' NPV's are equal. Round your answer to two decimal places. d. Why is NPV better than IRR for making capital budgeting decisions that add to shareholder value? The input in the box below will not be graded, but may be reviewed and considered by your instructor A company is considering two mutually exclusive expansion plans. Plan A requires a $39 million expenditure on a large-scale integrated plant that would provide expected cash flows of 6.23 milion per year for 20 years, Plan B requires a $13 million expenditure to build a somewhat less efficient, more labor-intensive plant with an expected cash flow of $2.91 million per year for 20 years. The firm's WACC is 10%. The data has been collected in the Microsoft Excel Online Hile below. Open the spreadsheet and perform the required analysis to answer the questions below 000 theat a. Calculate each project's NPV. Round your answers to two decimal places. Do not round your intermediate calculations. Enter your answers in millions. For example, an answer of $10,550,000 should be entered as 10.55. Plan A 5 million Plan 8:5 million Calculate each project's IRR. Round your answer to two decimal places Plan : 90 Plan B: b. By graphing the NPV profiles for Plan A and Plan B, approximate the crossover rate to the nearest percent 96 c. Calculate the crossover rate where the two projects' NPVs are equal. Round your answer to two decimal places . Why is NPV better than IRR for making capital budgeting decisions that add to shareholder value? The input in the box below will not be graded, but may be reviewed and considered by your instructor 1 prots WACO 100 www. 11 10 17 300 10 M2 20 CE 1023 E 1623 23 H E 21 41300 10 10 16 2 163 21 1621 16 HP IN T | CAN HAI H. 11 WN My Calw Wh MUL 12 10 Pro 1 Dom WO SON 10% 204 22 24 $0.00 0000 1000 10.00 1000 10.00 30.00 30.00 10.00 1000 30.00 10:00 3000 1000 3000 50.00 NPV Profiles St 100 0 15 ! 36.23 10 3629 36 23 12 9623 3523 14 23 36.23 10 $0.23 800 362388 13 5623 1625 23 15 3623 562) 18 1623 SE 9 5623 -91300 32.95 09 165 3291 1621 3291 1625 105 291 3291 1628 52.91 3291 $2.05 15 int 1505 12.01 Wat Formas vis V WA HUA BESAREBE NPV. 30.00 10.00 1000 $0.00 5000 50.00 $0.00 3000 NPVA 10.00 3000 30.00 30.00 30.00 1000 30.00 30.00 NPV Profiles 11 N 0 w 20 000 0006 000 000 0.00 NPV Profiles IS w SN 11 Cal wation of Crower Rate . 15 HA 330.00 9825 5623 323 23 2 1623 12 26.25 13 5623 14 23 15 1623 56.23 18 1523 $13.00 R9 291 1621 3201 1291 12.90 2.91 29 1028 1291 LE 18 1623 $2.91 2.91 ies Proiect Forms YA Formula One . Aral Chian 13 2 M N 0 P 5 T U V 2 3000 1000 1000 300 50.00 5000 8000 $0.00 20 23 2 2) 3000 NPV Profiles 11 PE 53 IT 41 4 ate 3 16 15 1 3625 9 96.23 -88900 2 $6.23 12 96.23 5523 18 96.23 19 5 3523 13 3023 CES 3523 36.23 5623 1 OF 56 23 14 3623 15 36.23 CZ 95 11 5623 so za 36 23 31300 3291 1078 V $2.91 3291 $2291 9291 $2.91 1525 92.31 $2.95 52.91 1628 $2.51 $291 $2.91 52.61 50 51 52 mulas VIN Ah ARMARINA ANA NA V VIN ANA is Formula
