Answered step by step
Verified Expert Solution
Question
1 Approved Answer
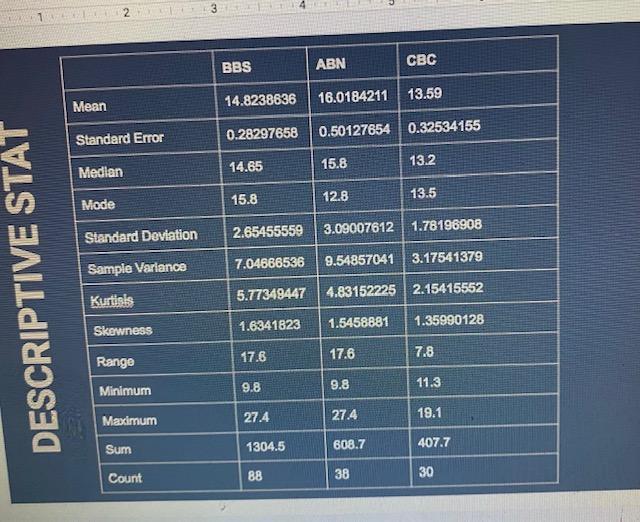
A. How are the networks performing on above data By comparing and interpreting the metrics in the descriptive stats table. BBS ABN CBC 14.8238636 16.0184211

A. How are the networks performing on above data By comparing and interpreting the metrics in the descriptive stats table.
BBS ABN CBC 14.8238636 16.0184211 Mean 13.59 0.28297658 Standard Error 0.50127654 0.32534155 14.65 15.8 Median 13.2 15.8 12.8 Mode 13.5 Standard Deviation 2.65455559 3.09007612 1.76196908 7.04666536 Sample Variance 9.54857041 3.17541379 DESCRIPTIVE STAT Kurtists 5.77349447 4.83152225 2.15415552 1.6341823 1.5458881 Skewness 1.35990128 17.6 17.6 7.8 Range 9.8 9.8 Minimum 11.3 Masimum 27.4 27.4 19.1 Sum 1304.5 608.7 407.7 Count 88 38 30 BBS ABN CBC 14.8238636 16.0184211 Mean 13.59 0.28297658 Standard Error 0.50127654 0.32534155 14.65 15.8 Median 13.2 15.8 12.8 Mode 13.5 Standard Deviation 2.65455559 3.09007612 1.76196908 7.04666536 Sample Variance 9.54857041 3.17541379 DESCRIPTIVE STAT Kurtists 5.77349447 4.83152225 2.15415552 1.6341823 1.5458881 Skewness 1.35990128 17.6 17.6 7.8 Range 9.8 9.8 Minimum 11.3 Masimum 27.4 27.4 19.1 Sum 1304.5 608.7 407.7 Count 88 38 30Step by Step Solution
There are 3 Steps involved in it
Step: 1

Get Instant Access to Expert-Tailored Solutions
See step-by-step solutions with expert insights and AI powered tools for academic success
Step: 2

Step: 3

Ace Your Homework with AI
Get the answers you need in no time with our AI-driven, step-by-step assistance
Get Started


