

Answered step by step
Verified Expert Solution
Question
1 Approved Answer
A research analyst is trying to determine whether a firm's price - earnings ( PE ) and price - sales ( PS ) ratios can
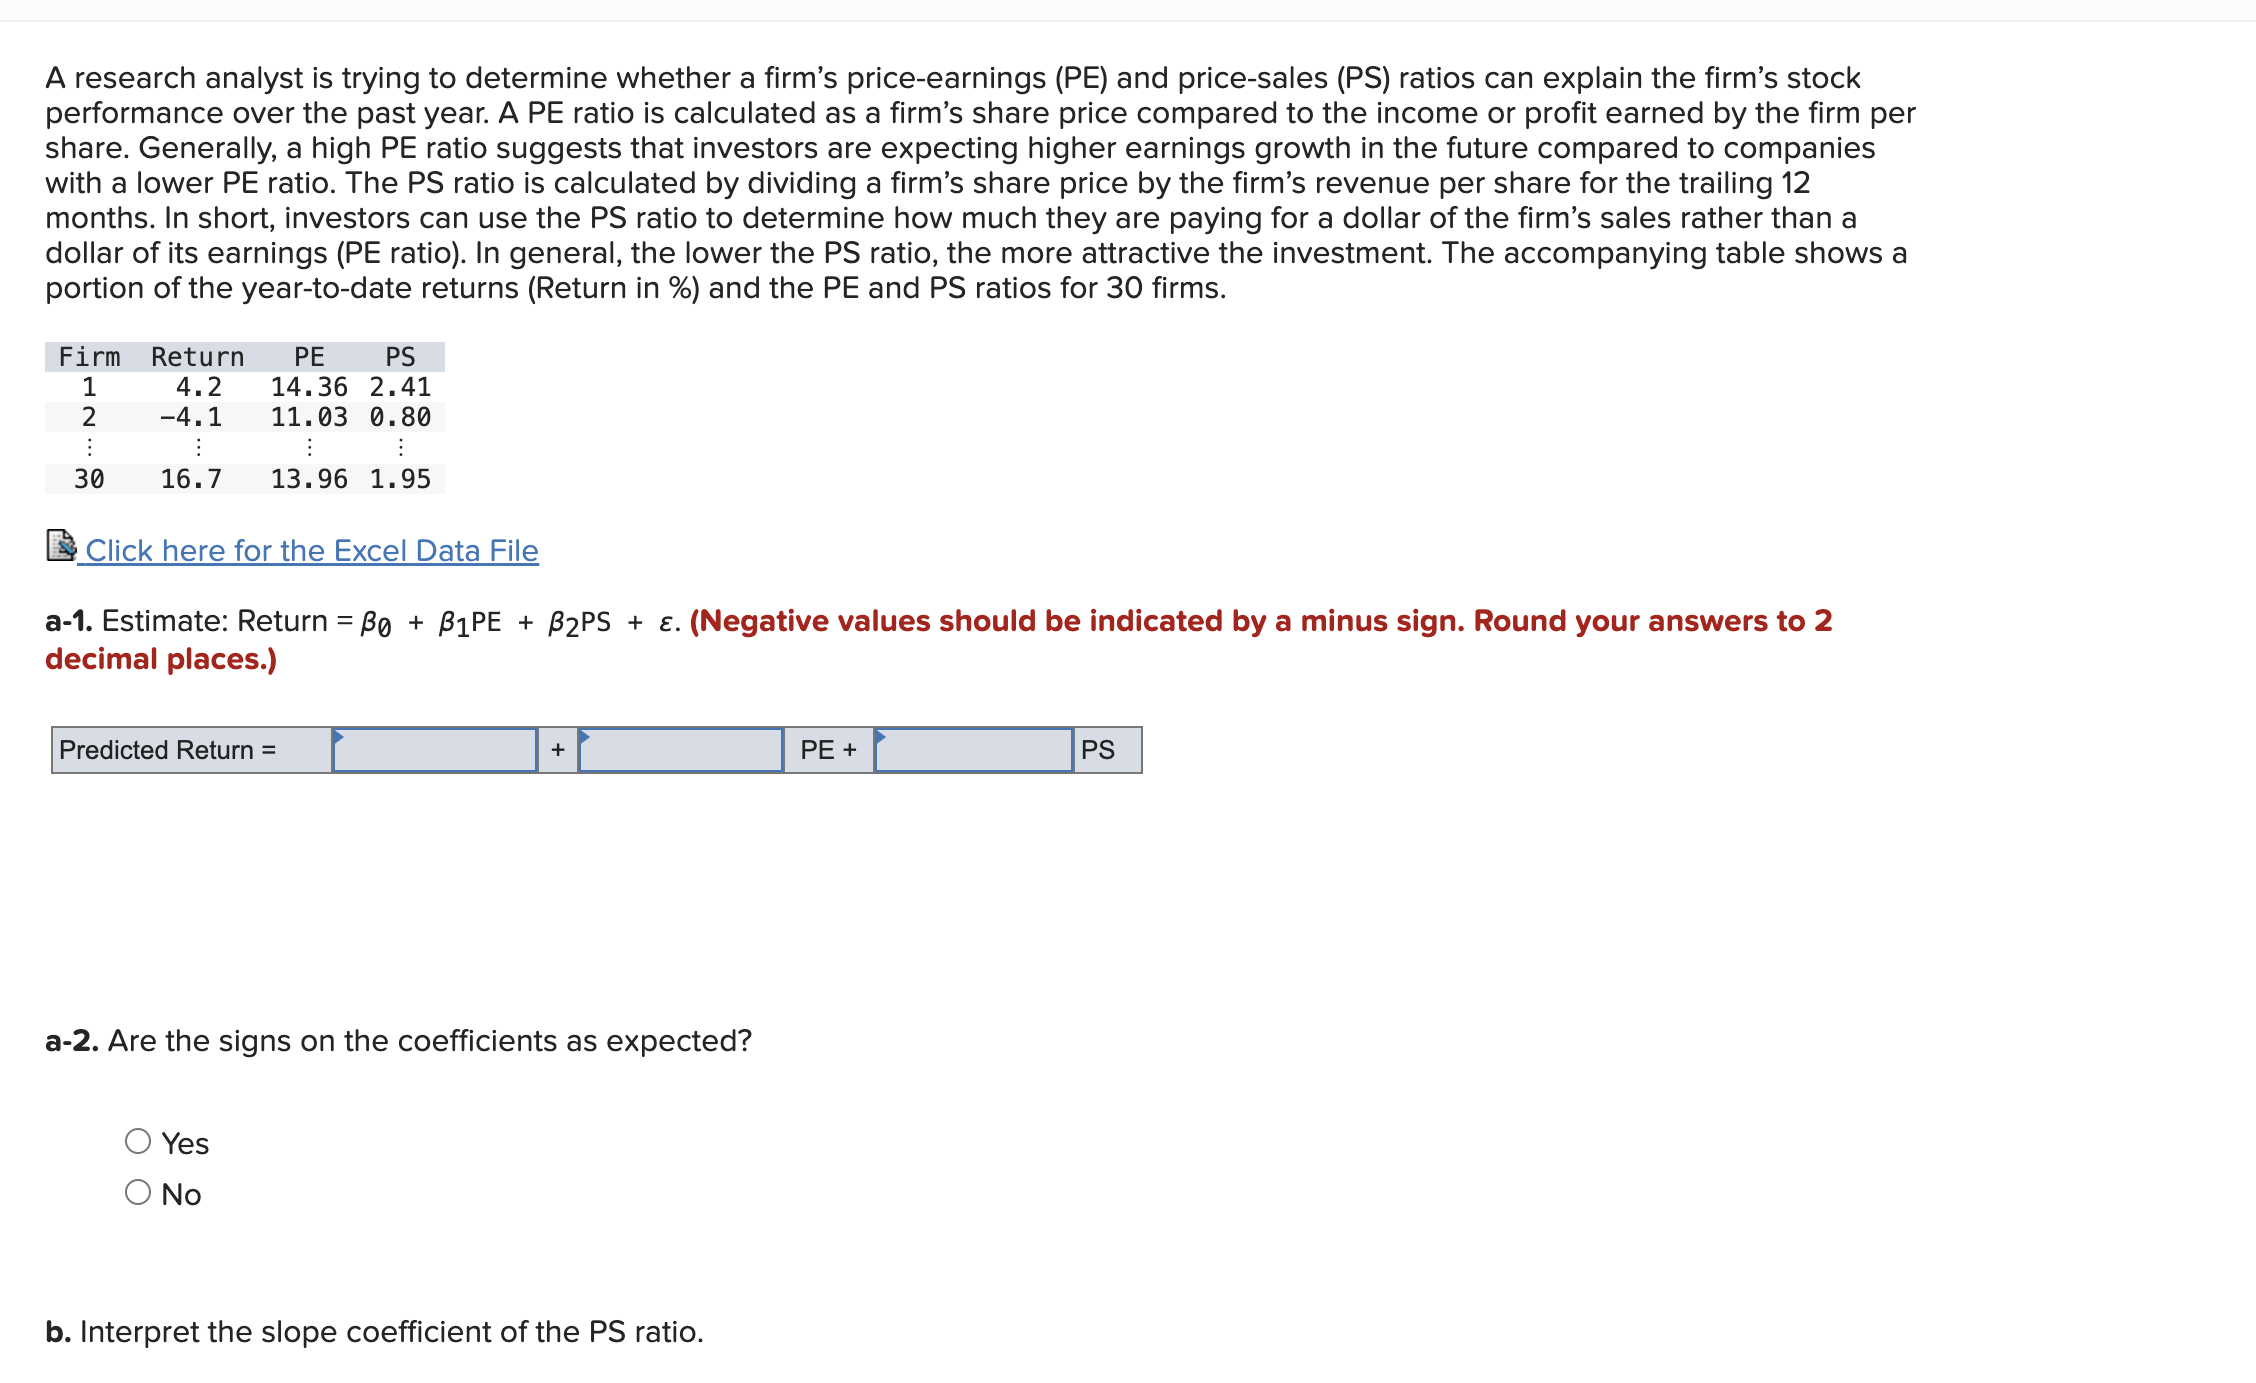
A research analyst is trying to determine whether a firm's priceearnings PE and pricesales PS ratios can explain the firm's stock
performance over the past year. A PE ratio is calculated as a firm's share price compared to the income or profit earned by the firm per
share. Generally, a high PE ratio suggests that investors are expecting higher earnings growth in the future compared to companies
with a lower PE ratio. The PS ratio is calculated by dividing a firm's share price by the firm's revenue per share for the trailing
months. In short, investors can use the PS ratio to determine how much they are paying for a dollar of the firm's sales rather than a
dollar of its earnings PE ratio In general, the lower the PS ratio, the more attractive the investment. The accompanying table shows a
portion of the yeartodate returns Return in and the PE and PS ratios for firms.
Click here for the Excel Data File
a Estimate: Return PE Negative values should be indicated by a minus sign. Round your answers to
decimal places.
Predicted Return
a Are the signs on the coefficients as expected?
Yes
No
b Interpret the slope coefficient of the PS ratio.
As the PS ratio increases by unit, the predicted return of the firm decreases by holding PE constant.
As the PS ratio increases by unit, the predicted return of the firm decreases by holding PE constant.
As the PS ratio decreases by unit, the predicted return of the firm decreases by holding PE constant.
As the PS ratio increases by unit, the predicted return of the firm increases by holding PE constant.
c What is the predicted return for a firm with a PE ratio of and a PS ratio of Negative value should be indicated by a minus sign. Do not round intermediate calculations. Round final answer to decimal places.
d What is the standard error of the estimate? Round your answer to decimal places.
e Interpret R
multiple choice
of the sample variation in y is explained by the sample regression equation.
of the sample variation in x is explained by the sample regression equation.
of the sample variation in x is explained by the sample regression equation.
of the sample variation in y is explained by the sample regression equation.
DATA:
Firm, Return, PE PS
Step by Step Solution
There are 3 Steps involved in it
Step: 1

Get Instant Access to Expert-Tailored Solutions
See step-by-step solutions with expert insights and AI powered tools for academic success
Step: 2

Step: 3
Ace Your Homework with AI
Get the answers you need in no time with our AI-driven, step-by-step assistance
Get Started
International Financial Reporting A Practical Guide
Authors: Alan Melville
6th edition
1292200743, 1292200766, 9781292200767, 978-1292200743