Answered step by step
Verified Expert Solution
Question
1 Approved Answer
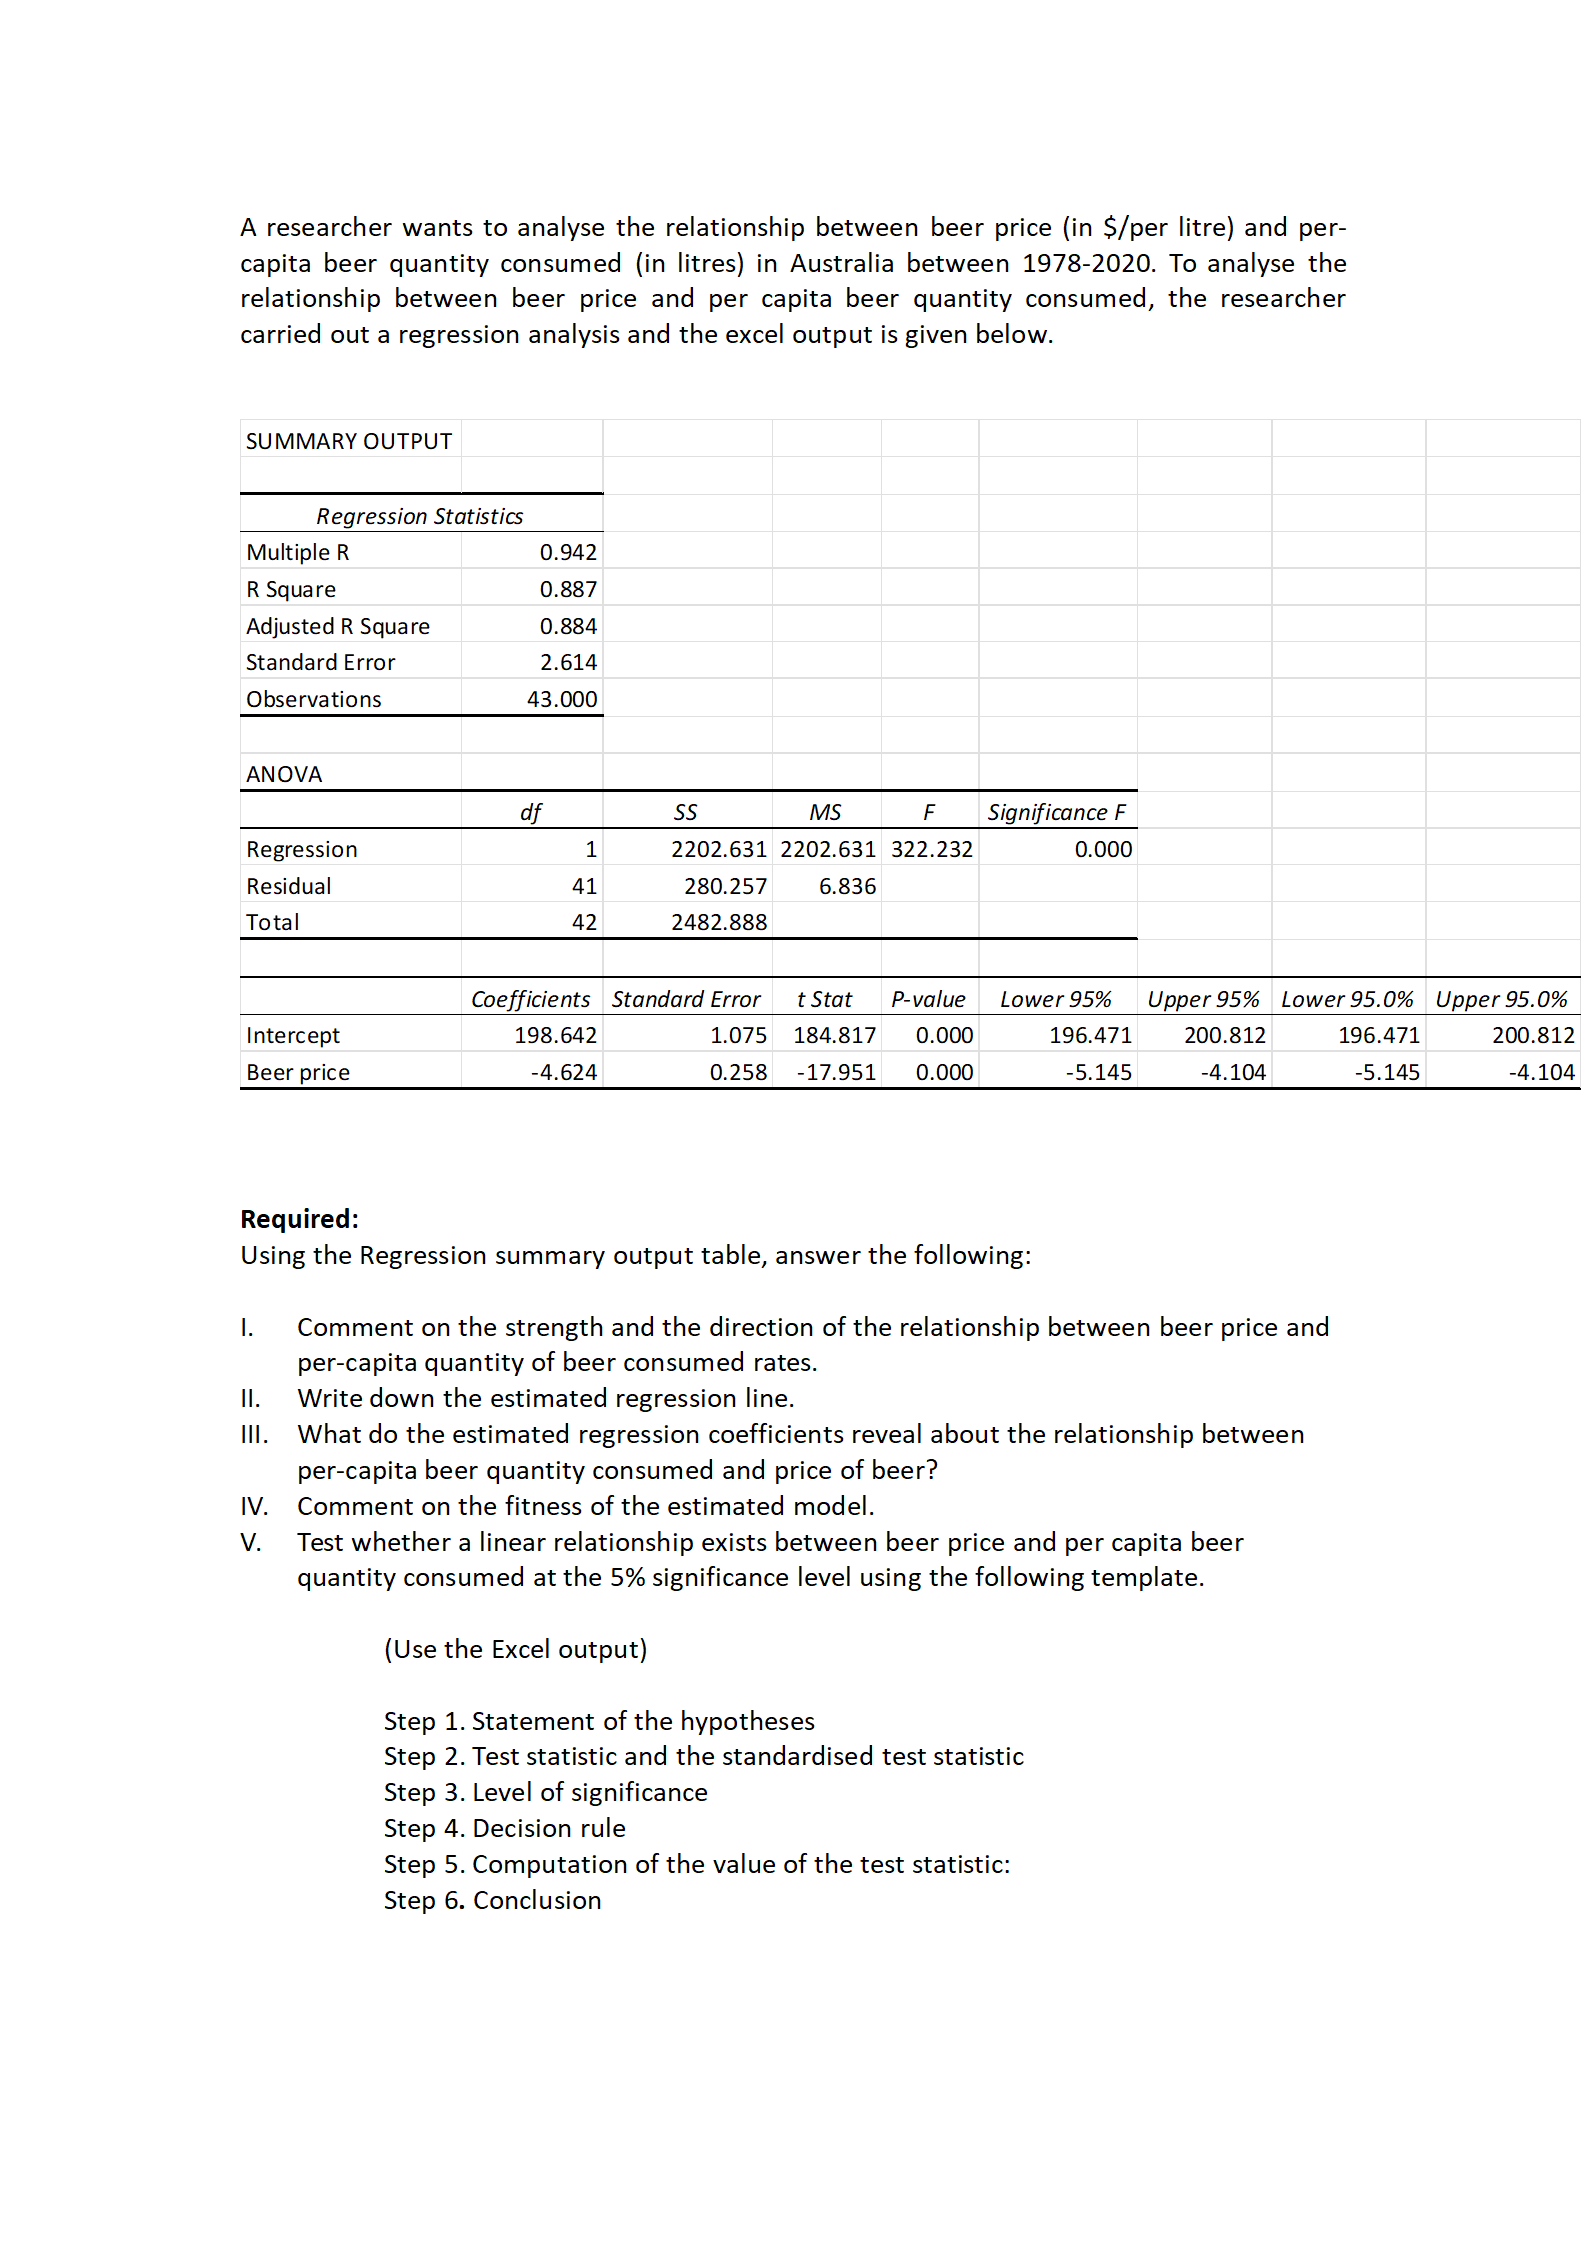
A researcher wants to analyse the relationship between beer price (in $/ per litre) and percapita beer quantity consumed (in litres) in Australia between 1978-2020.
 A researcher wants to analyse the relationship between beer price (in $/ per litre) and percapita beer quantity consumed (in litres) in Australia between 1978-2020. To analyse the relationship between beer price and per capita beer quantity consumed, the researcher carried out a regression analysis and the excel output is given below. Required: Using the Regression summary output table, answer the following: I. Comment on the strength and the direction of the relationship between beer price and per-capita quantity of beer consumed rates. II. Write down the estimated regression line. III. What do the estimated regression coefficients reveal about the relationship between per-capita beer quantity consumed and price of beer? IV. Comment on the fitness of the estimated model. V. Test whether a linear relationship exists between beer price and per capita beer quantity consumed at the 5% significance level using the following template. (Use the Excel output) Step 1. Statement of the hypotheses Step 2. Test statistic and the standardised test statistic Step 3. Level of significance Step 4. Decision rule Step 5. Computation of the value of the test statistic: Step 6. Conclusion
 Step by Step Solution
There are 3 Steps involved in it
Step: 1

Get Instant Access to Expert-Tailored Solutions
See step-by-step solutions with expert insights and AI powered tools for academic success
Step: 2

Step: 3

Ace Your Homework with AI
Get the answers you need in no time with our AI-driven, step-by-step assistance
Get Started


