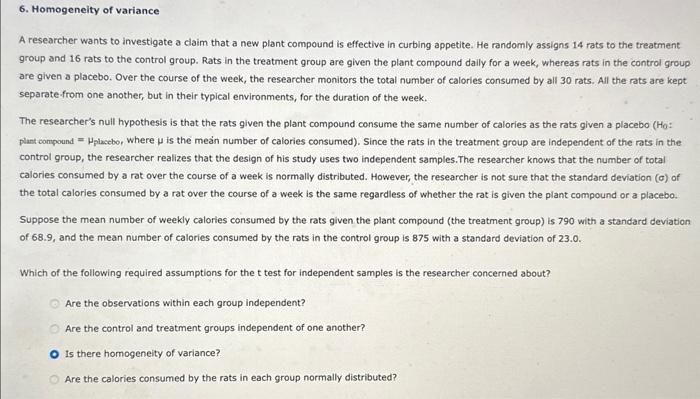
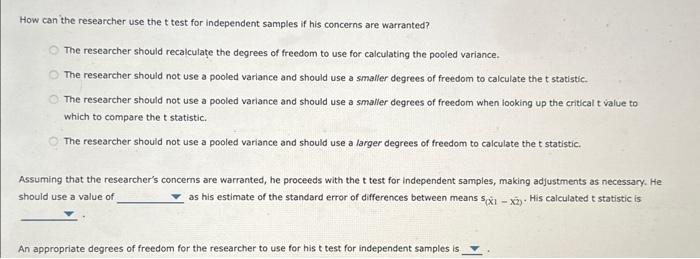
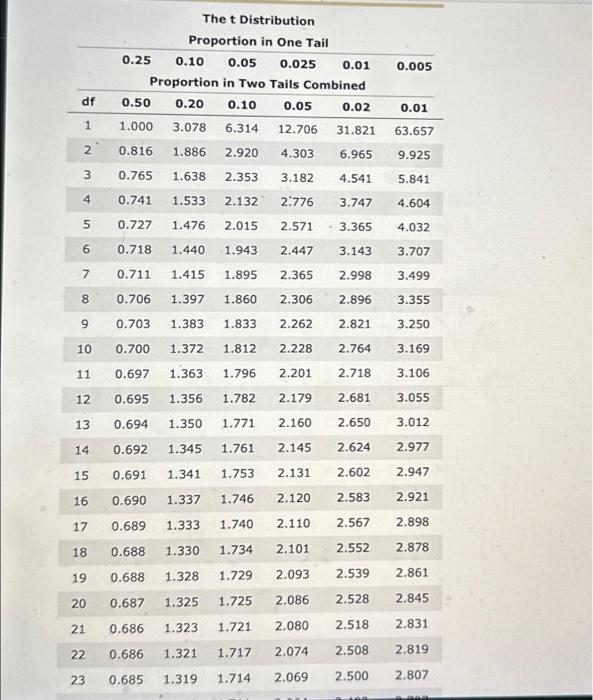
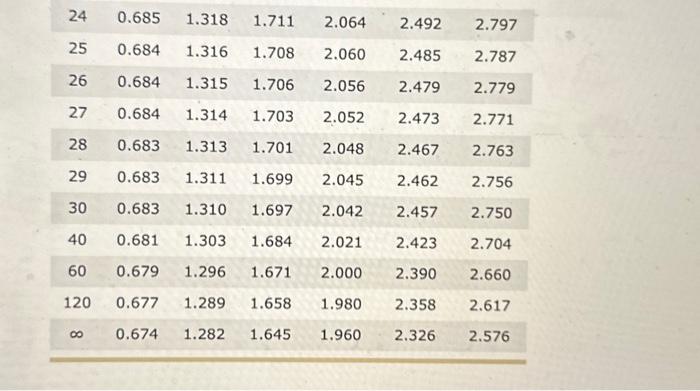
A researcher wants to investigate a claim that a new plant compound is effective in curbing appetite. He randomly assigns 14 rats to the treatment group and 16 rats to the control group. Rats in the treatment group are given the plant compound daily for a week, whereas rats in the control group are given a placebo. Over the course of the week, the researcher monitors the total number of calories consumed by all 30 rats. All the rats are kept separate-from one another, but in their typical environments, for the duration of the week. The researcher's null hypothesis is that the rats given the plant compound consume the same number of calories as the rats given a placebo (Ho: plant compound =placebo, where is the mean number of calories consumed). Since the rats in the treatment group are independent of the rats in the control group, the researcher realizes that the design of his study uses two independent samples. The researcher knows that the number of total calories consumed by a rat over the course of a week is normally distributed. However, the researcher is not sure that the standard deviation (a) of the total calories consumed by a rat over the course of a week is the same regardless of whether the rat is given the plant compound or a placebo. Suppose the mean number of weekly calories consumed by the rats given the plant compound (the treatment group) is 790 with a standard deviation of 68.9 , and the mean number of calories consumed by the rats in the control group is 875 with a standard deviation of 23.0 . Which of the following required assumptions for the t test for independent samples is the researcher concerned about? Are the observations within each group independent? Are the control and treatment groups independent of one another? Is there homogeneity of variance? Are the calories consumed by the rats in each group normally distributed? How can the researcher use the t test for independent samples if his concerns are warranted? The researcher should recalculae the degrees of freedom to use for calculating the pooled variance. The researcher should not use a pooled variance and should use a smaller degrees of freedom to calculate the t statistic. The researcher should not use a pooled variance and should use a smafler degrees of freedom when iooking up the critical t value to which to compare the t statistic. The researcher should not use a pooled variance and should use a larger degrees of freedom to calculate the t statistic. Assuming that the researcher's concerns are warranted, he proceeds with the t test for independent samples, making adjustments as necessary. Heshould use a value of as his estimate of the standard error of differences between means 5(X)X2). His calculated t statistic is The t Distribution Proportion in One Tail 0.250.100.050.0250.010.005 Proportion in Two Tails Combined \begin{tabular}{ccccccc} 24 & 0.685 & 1.318 & 1.711 & 2.064 & 2.492 & 2.797 \\ 25 & 0.684 & 1.316 & 1.708 & 2.060 & 2.485 & 2.787 \\ 26 & 0.684 & 1.315 & 1.706 & 2.056 & 2.479 & 2.779 \\ 27 & 0.684 & 1.314 & 1.703 & 2.052 & 2.473 & 2.771 \\ 28 & 0.683 & 1.313 & 1.701 & 2.048 & 2.467 & 2.763 \\ \hline 29 & 0.683 & 1.311 & 1.699 & 2.045 & 2.462 & 2.756 \\ 30 & 0.683 & 1.310 & 1.697 & 2.042 & 2.457 & 2.750 \\ 40 & 0.681 & 1.303 & 1.684 & 2.021 & 2.423 & 2.704 \\ \hline 0 & 0.679 & 1.296 & 1.671 & 2.000 & 2.390 & 2.660 \\ 120 & 0.677 & 1.289 & 1.658 & 1.980 & 2.358 & 2.617 \\ & 0.674 & 1.282 & 1.645 & 1.960 & 2.326 & 2.576 \\ \hline \end{tabular} Using the most appropriate adjusted degrees of freedom as provided in the selections above and a significance level of a = -05 for this two-tailed hypothesis test, the critical t values that form the boundaries of the rejection region with a=+05 are The researcher the null hypothesis and conclude that consuming the plant compound affects the average number of calories the rats consume


