A study in Computers and Electronics in Agriculture (Vol. 174, 2020) provides a method for obtaining uniform seed varieties from crop production. A computer vision
A study in Computers and Electronics in Agriculture (Vol. 174, 2020) provides a method for obtaining uniform seed varieties from crop production. A computer vision system was developed to distinguish seven different registered varieties of dry beans with similar features in order to obtain uniform seed classification. Images of 13,611 grains of the seven beans were taken with a high-resolution camera for the classification model. The images obtained using the computer vision system were subjected to segmentation and feature extraction stages, and a total of 16 features, 12 dimensions, and 4 shape forms were obtained from the grains. Here, you are going to analyze the relationship between the major axis length (y) (in pixels), and the minor axis length (x) (in pixels) of the beans, in which y is the distance between the ends of the longest line that can be drawn from a bean and x is the longest line that can be drawn from the bean while stationed perpendicular to the main axis. The data are saved in a file named "BeanDataset.csv" accompanied by this project on the Blackboard. You have to conduct a complete simple linear regression analysis of the data. Summarize your findings in a professional report
The data is too large and I posted the first part only. Its a total of 13611 observations for X and Y

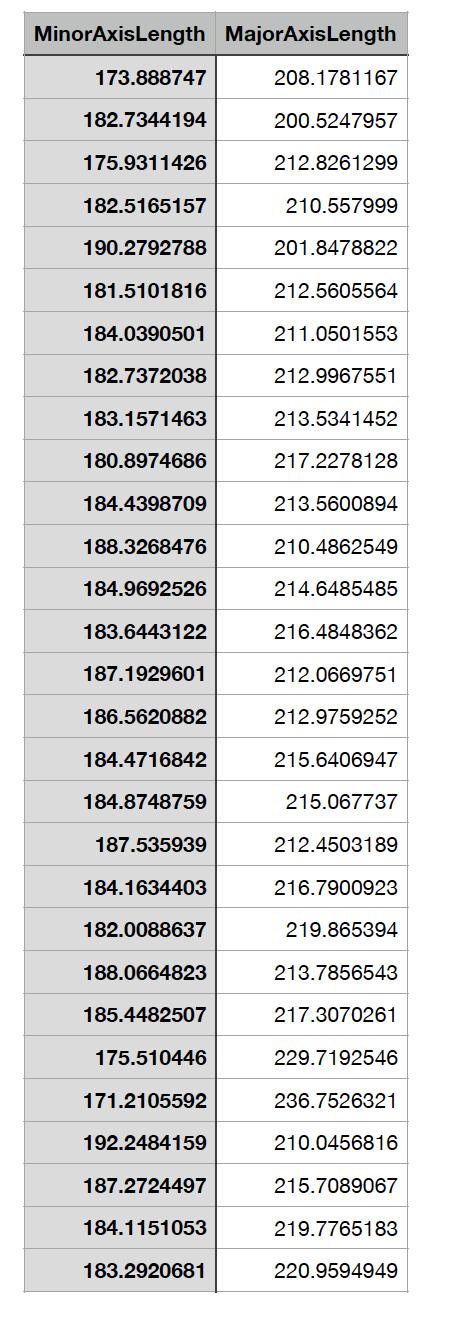
MinorAxisLength MajorAxisLength 173.888747 208.1781167 182.7344194 200.5247957 175.9311426 212.8261299 182.5165157 210.557999 190.2792788 201.8478822 181.5101816 212.5605564 184.0390501 211.0501553 182.7372038 212.9967551 183.1571463 213.5341452 180.8974686 217.2278128 184.4398709 213.5600894 188.3268476 210.4862549 184.9692526 214.6485485 183.6443122 216.4848362 187.1929601 212.0669751 186.5620882 212.9759252 184.4716842 215.6406947 184.8748759 215.067737 187.535939 212.4503189 184.1634403 216.7900923 182.0088637 219.865394 188.0664823 213.7856543 185.4482507 217.3070261 175.510446 229.7192546 171.2105592 236.7526321 192.2484159 210.0456816 187.2724497 215.7089067 184.1151053 219.7765183 183.2920681 220.9594949
Step by Step Solution
3.47 Rating (157 Votes )
There are 3 Steps involved in it
Step: 1
A C D E F G H J K M N P Q R 1 X minor axis Y Major axis X Mx Y My X M X MxY M Y My 2 173888747 20817...
See step-by-step solutions with expert insights and AI powered tools for academic success
Step: 2

Step: 3

Ace Your Homework with AI
Get the answers you need in no time with our AI-driven, step-by-step assistance
Get Started


