Question
A test feed containing 200 kg of solid is separated by a hydrocyclone and the particle size distribution in feed and underflow are given

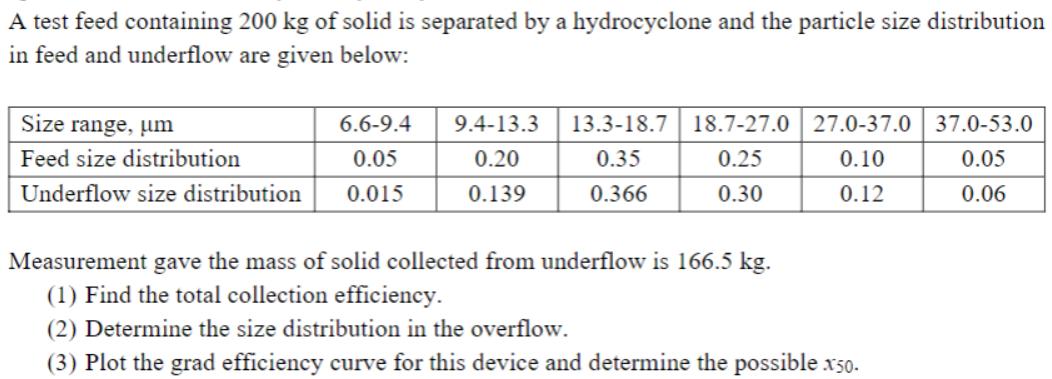
A test feed containing 200 kg of solid is separated by a hydrocyclone and the particle size distribution in feed and underflow are given below: Size range, um Feed size distribution Underflow size distribution 6.6-9.4 0.05 0.015 9.4-13.3 0.20 0.139 13.3-18.7 18.7-27.0 27.0-37.0 37.0-53.0 0.35 0.25 0.10 0.05 0.366 0.30 0.12 0.06 Measurement gave the mass of solid collected from underflow is 166.5 kg. (1) Find the total collection efficiency. (2) Determine the size distribution in the overflow. (3) Plot the grad efficiency curve for this device and determine the possible x50.
Step by Step Solution
3.46 Rating (175 Votes )
There are 3 Steps involved in it
Step: 1

Get Instant Access to Expert-Tailored Solutions
See step-by-step solutions with expert insights and AI powered tools for academic success
Step: 2

Step: 3

Ace Your Homework with AI
Get the answers you need in no time with our AI-driven, step-by-step assistance
Get StartedRecommended Textbook for
Separation Process Principles Chemical And Biochemical Principles
Authors: By J. D. Seader, Ernest J. Henley, D. Keith Roper
3rd Edition
0470481838, 978-0470481837
Students also viewed these Chemical Engineering questions
Question
Answered: 1 week ago
Question
Answered: 1 week ago
Question
Answered: 1 week ago
Question
Answered: 1 week ago
Question
Answered: 1 week ago
Question
Answered: 1 week ago
Question
Answered: 1 week ago
Question
Answered: 1 week ago
Question
Answered: 1 week ago
Question
Answered: 1 week ago
Question
Answered: 1 week ago
Question
Answered: 1 week ago
Question
Answered: 1 week ago
Question
Answered: 1 week ago
Question
Answered: 1 week ago
Question
Answered: 1 week ago
Question
Answered: 1 week ago
Question
Answered: 1 week ago
Question
Answered: 1 week ago
Question
Answered: 1 week ago
Question
Answered: 1 week ago
View Answer in SolutionInn App


