

Question: (a) The graph shows a Standard Normal Distribution. You are given 1 or 2 z-score(s) and need to shade the area (=probability) corresponding to:
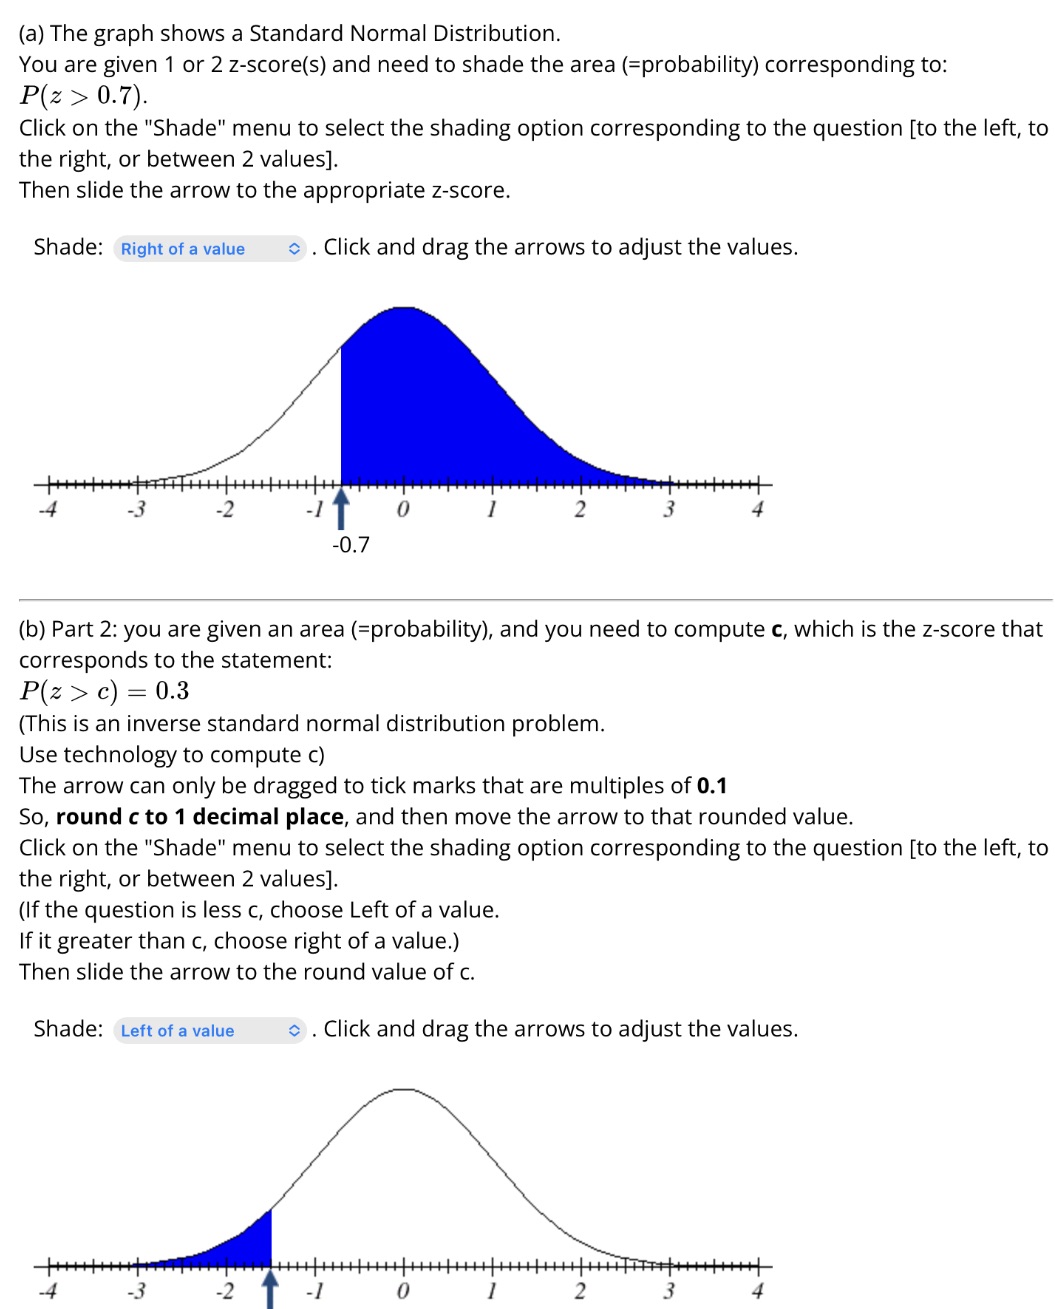
(a) The graph shows a Standard Normal Distribution. You are given 1 or 2 z-score(s) and need to shade the area (=probability) corresponding to: P(z > 0.7). Click on the "Shade" menu to select the shading option corresponding to the question [to the left, to the right, or between 2 values]. Then slide the arrow to the appropriate z-score. Shade: Right of a value . Click and drag the arrows to adjust the values. -4 -2 0 1 2 3 4 -0.7 (b) Part 2: you are given an area (=probability), and you need to compute c, which is the z-score that corresponds to the statement: P(z > c) = 0.3 (This is an inverse standard normal distribution problem. Use technology to compute c) The arrow can only be dragged to tick marks that are multiples of 0.1 So, round c to 1 decimal place, and then move the arrow to that rounded value. Click on the "Shade" menu to select the shading option corresponding to the question [to the left, to the right, or between 2 values]. (If the question is less c, choose Left of a value. If it greater than c, choose right of a value.) Then slide the arrow to the round value of c. Shade: Left of a value . Click and drag the arrows to adjust the values. -4 -3 -2 -1 0 1 -3 -2 4
Step by Step Solution
There are 3 Steps involved in it

Get step-by-step solutions from verified subject matter experts